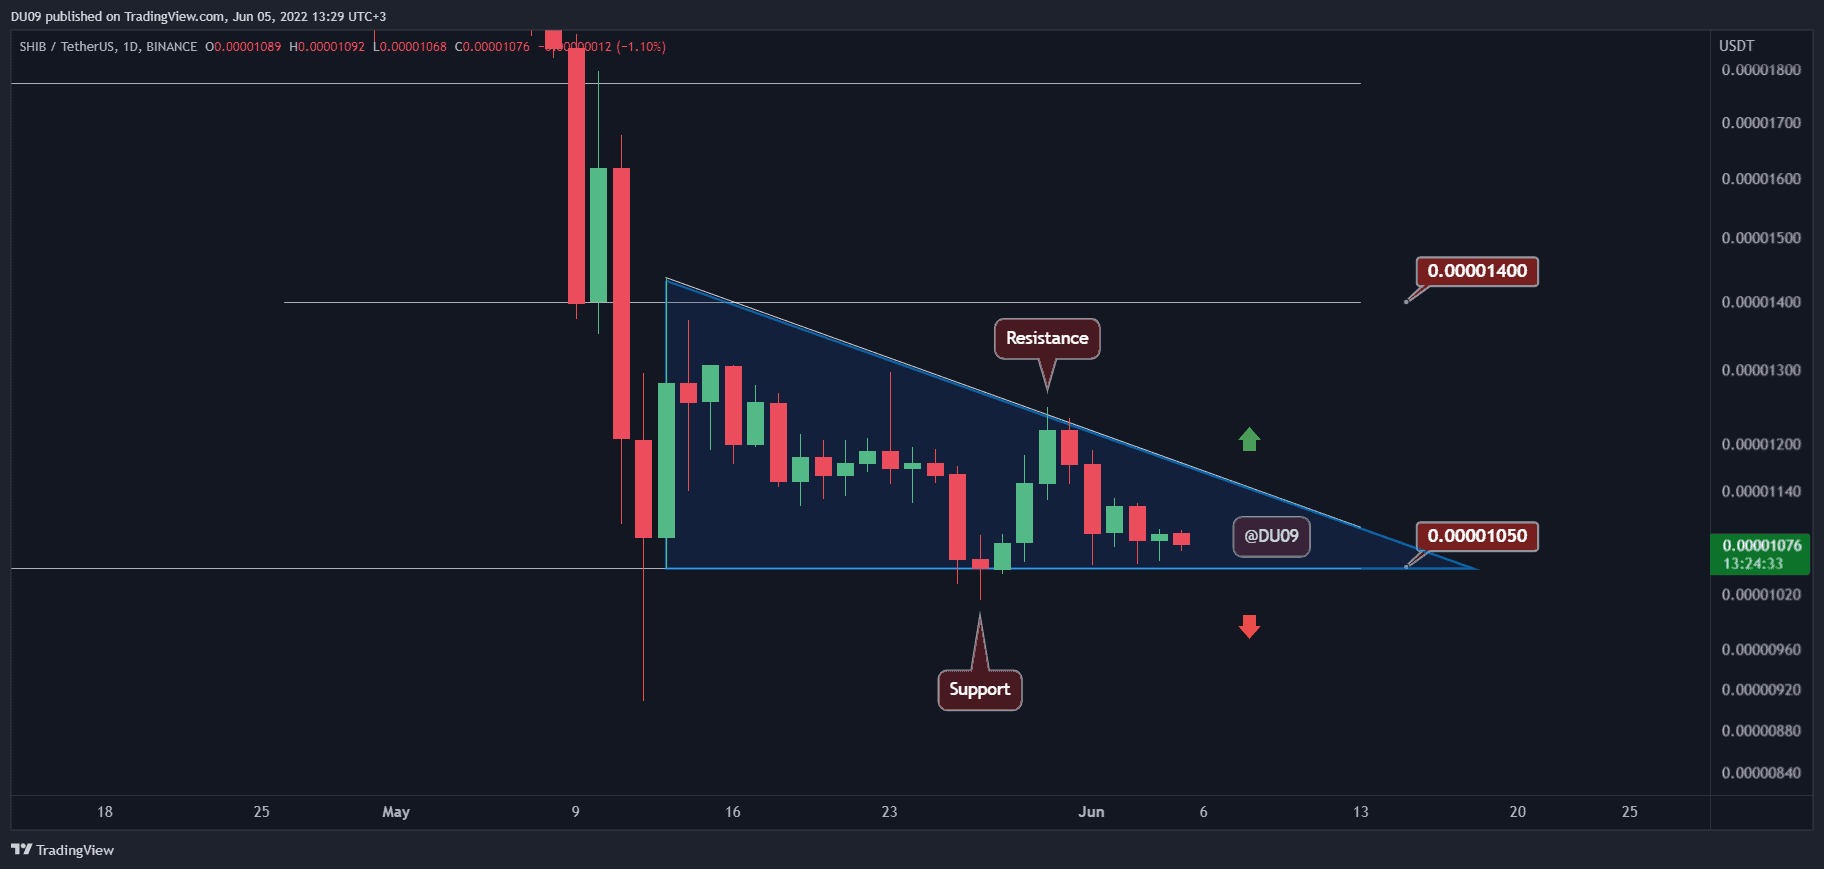
Over the past bearish weeks, Shiba Inu has formed a large descending triangle, and the price is approaching its apex. The next direction for Shiba Inu’s SHIB will be decided once a breakout occurs.
Key Support level: $0.000010, $0.000008
Key Resistance level: $0.000011, $0.000014
With the key support at $0.000010, SHIB’s price will approach a critical point. The descending triangle – marked blue on the following chart – is only days away from reaching its apex. This pattern is textbook bearish (70% breakout to the downside), however, a bullish breakout is also something to keep in mind.
SHIB will likely surpass the key resistance at $0.000011 and target higher if broken above.
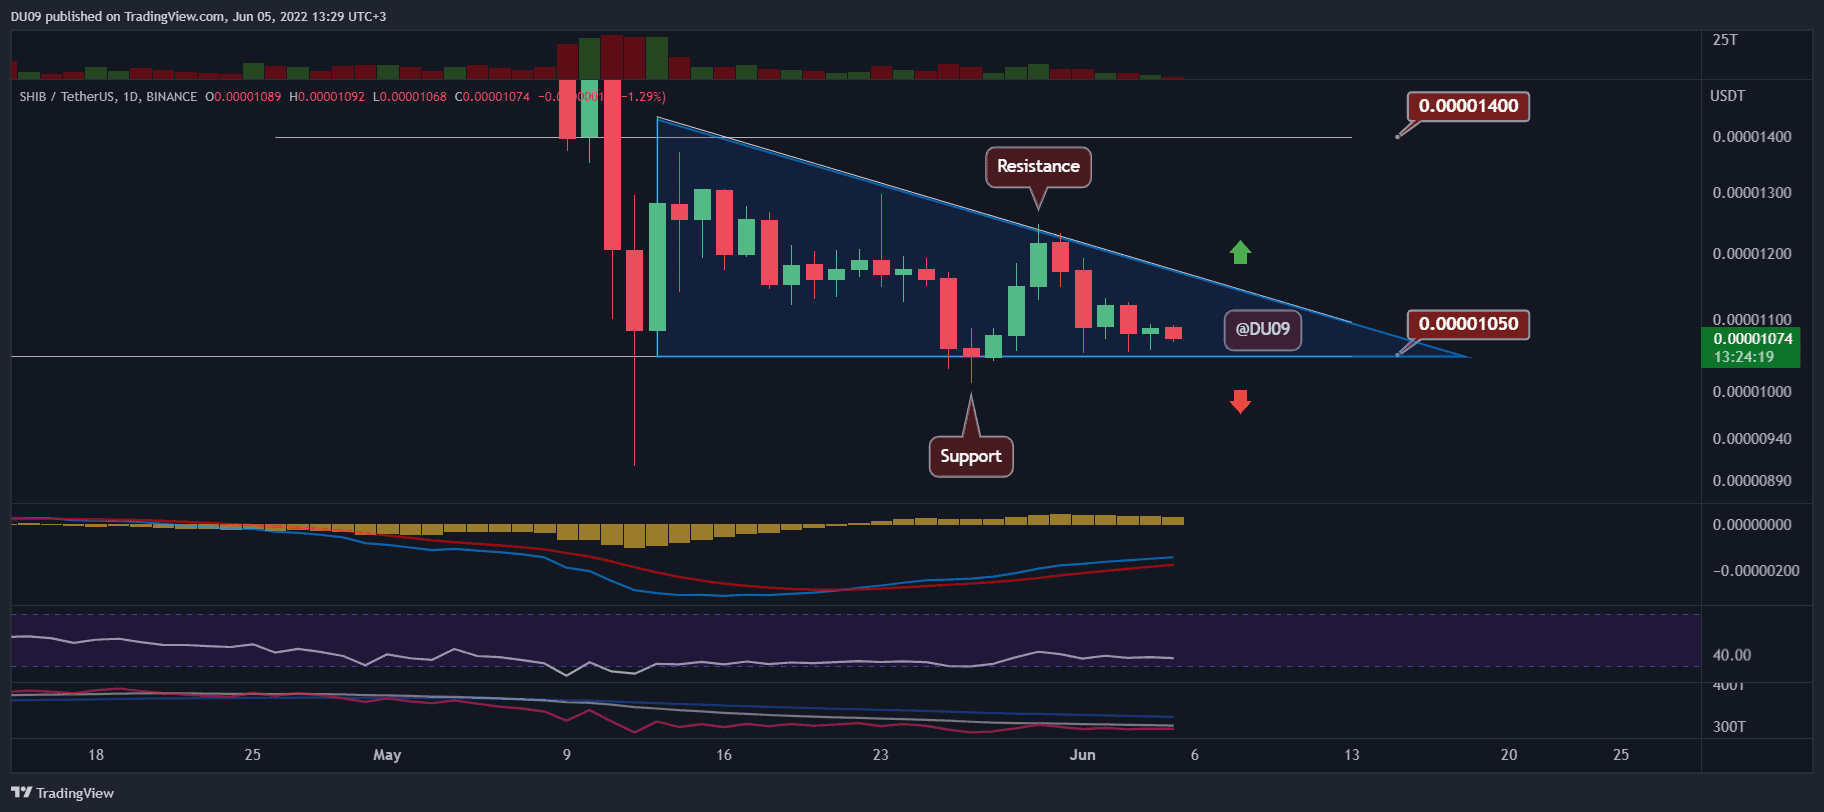
Technical Indicators
Trading Volume: The trading volume is almost nonexistent right now, mainly because of the weekend.
RSI: The daily RSI failed to move above 50 points and is currently making lower highs. This is somewhat bearish.
MACD: The daily MACD remains bullish, but the histogram mirrors the volume with lower highs.
Bias
The bias on SHIB is neutral, and a break of this triangle is needed in order to change this bias.
Short-Term Prediction for SHIB Price
With most of the market being flat, whereas Bitcoin consolidates between $28-30K, it is expected that SHIB will consolidate until the anticipated triangle’s breakout.
The mentioned-above indicators also provide mixed signals, so it is best to prepare for the worst outcome or breakout and hope for a positive breakout if you’re a SHIB holder.