Bitcoin has experienced a choppy price action following nine consecutive red weekly candles. Over the past few days, the price has consolidated between the $28K and $31K range. This is also the yearly low recorded in May 2021.
Technical Analysis
Technical Analysis By: Edris
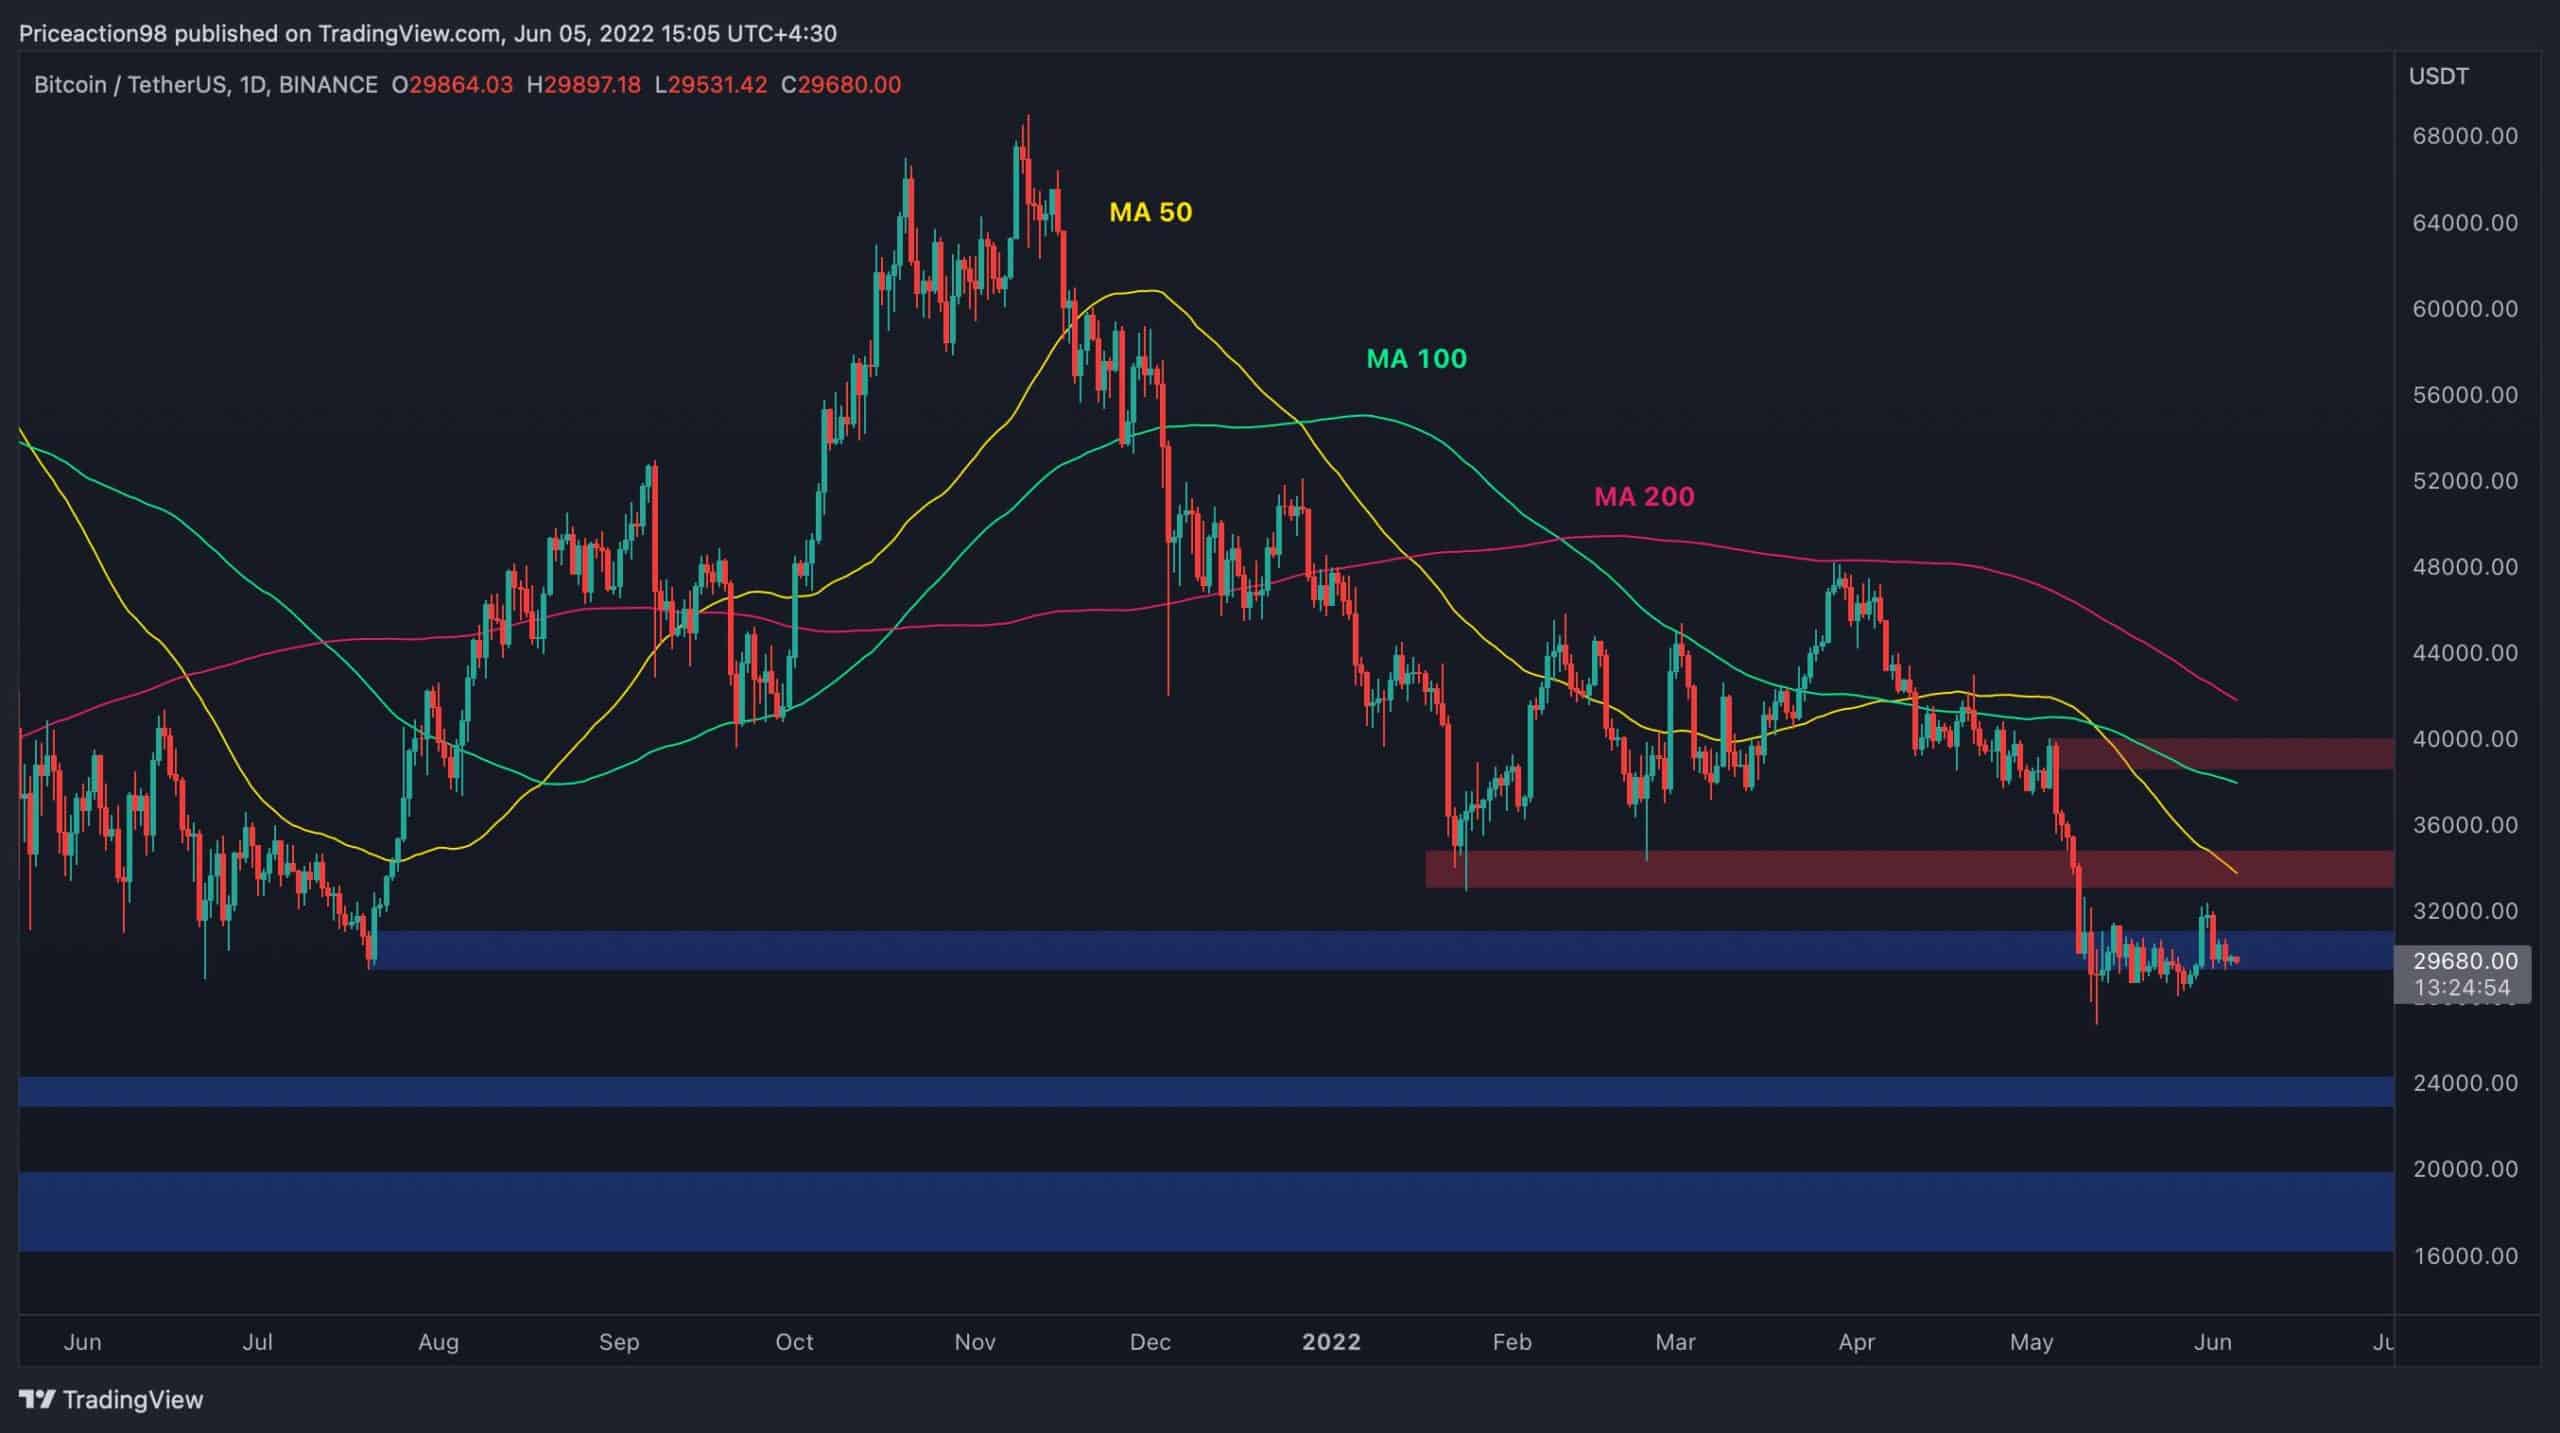
The Daily Chart: Long-Term Overview
Suppose the price could finally rebound from this range – then the 50-day moving average line, alongside the $35K area will likely serve as major resistance levels, respectively, which – if failed to break – could initiate the next run lower.
On the other hand, the bearish momentum is still ongoing, and the price could break below the $28K level even without a relief rally. In that scenario, the $24K will be the next demand zone. Failing to hold the latter, BTC might retest the 2017 bull market’s all-time high at the $17K-$20K region, a level which could finally act as this bear market’s bottom.
A sidenote – Bitcoin never retested a previous bull market’s top, and in this case, this will be the first time.
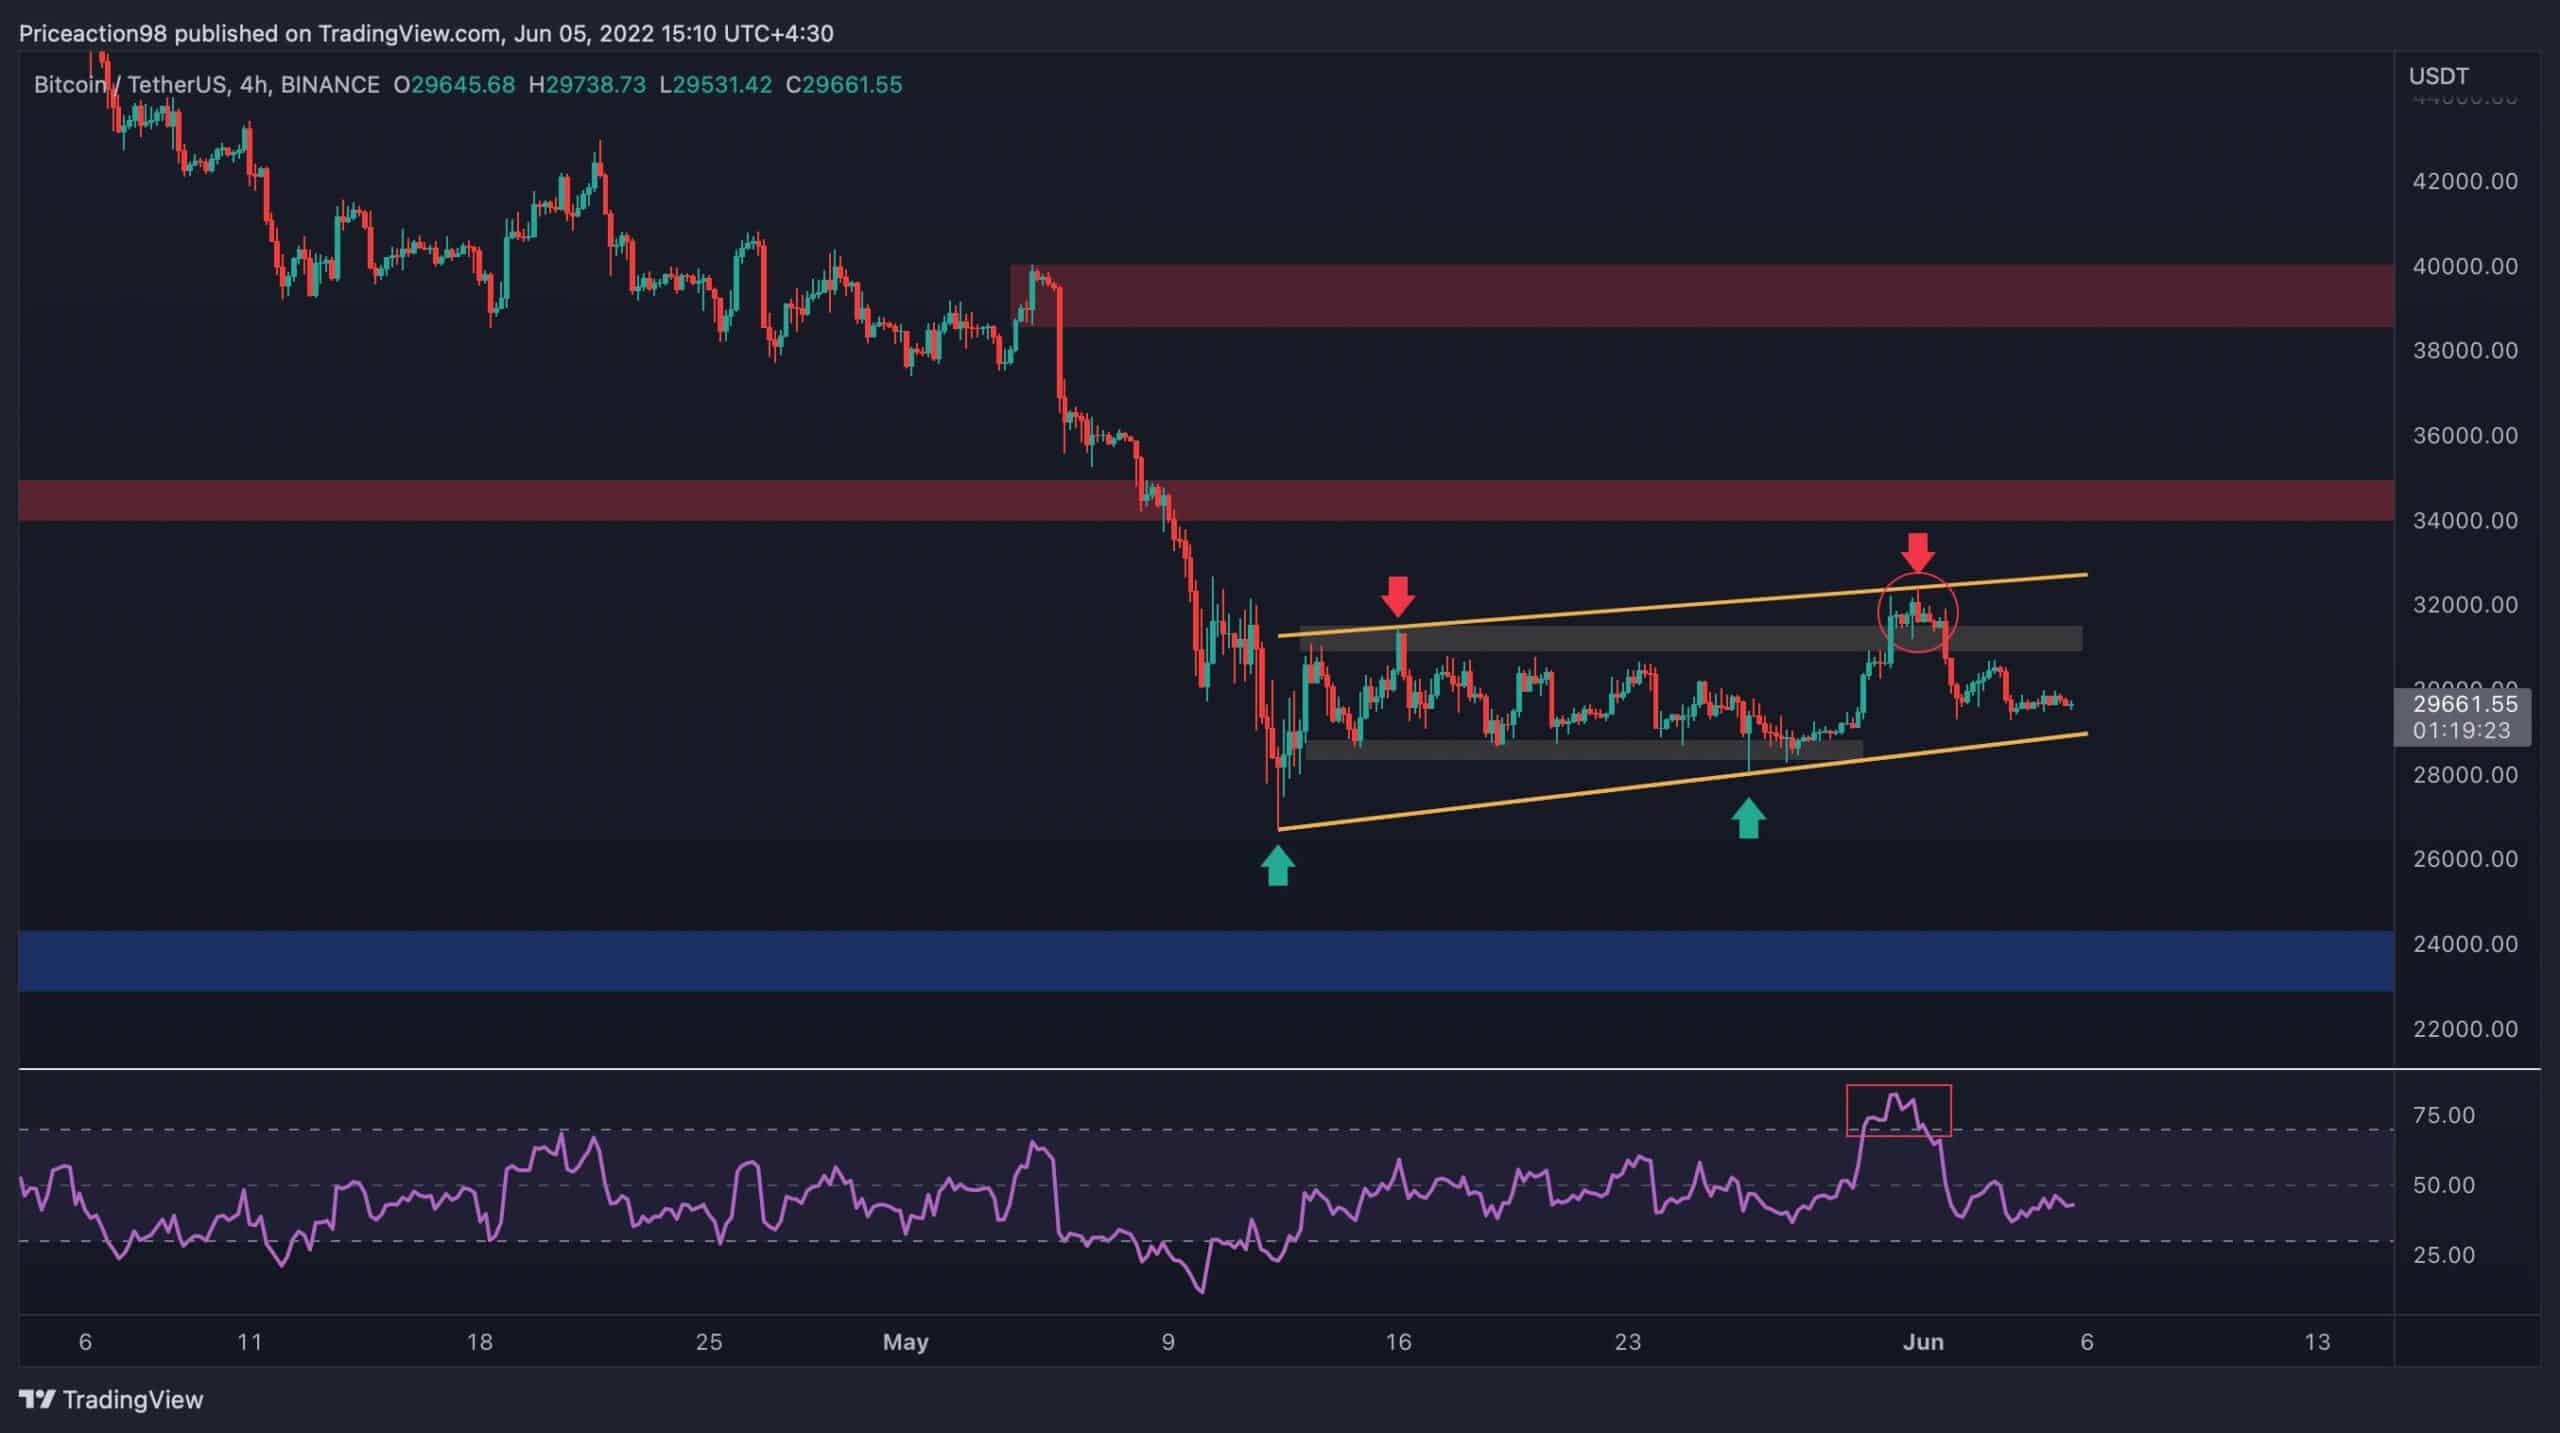
The 4-Hour Chart
On the 4-hour timeframe, the price was seemingly oscillating in a meaningless way over the last few weeks, liquidating both the buyers and the sellers on either side of the $31K – $28K horizontal range. However, the price action finally demonstrates some clues for its next direction, as a bearish flag pattern forms on the shot time frame chart.
The second touch of the top trendline, which has formed the bearish flag, was a fake bullish breakout from the $31K resistance level and could be identified by the massive overbought signal in the RSI.
The bearish flag was confirmed after the price dropped back inside the range, and it is currently heading towards the lower boundary of the pattern.
A bear flag is a bearish continuation pattern and indicates the high probability of another impulsive downside move towards $24K if the pattern gets broken down.
However, a third touch of the flag’s top boundary could also occur before the expected bearish continuation. This third touch usually forms an RSI’s bearish divergence with the second touch, which would further confirm the bearish bias.
Onchain Analysis
Onchain Analysis By Shayan
Reviewing the overall sentiment of market participants helps to study the market’s trend. A bullish cycle typically ends when big players enter the ‘distribution phase’ and start selling their assets and realizing their profits.
Meanwhile, retailers are experiencing FOMO and supplying the market’s demand side. On the other hand, a bearish cycle often ends when big players enter the ‘accumulation phase’ and start accumulating coins from weak hands at a discount.
Small players usually panic-sell their assets and realize their losses during this market phase while the smart money accumulates.
The following chart demonstrates the NUPL metric, which represents the overall amount of profit/loss as a ratio. The metric has dropped to the green range (= 0.66) due to a considerable decline in Bitcoin’s price. Historically, when the metric plunged into the blue region, the market experienced a significant capitulation, followed by a bullish rally.
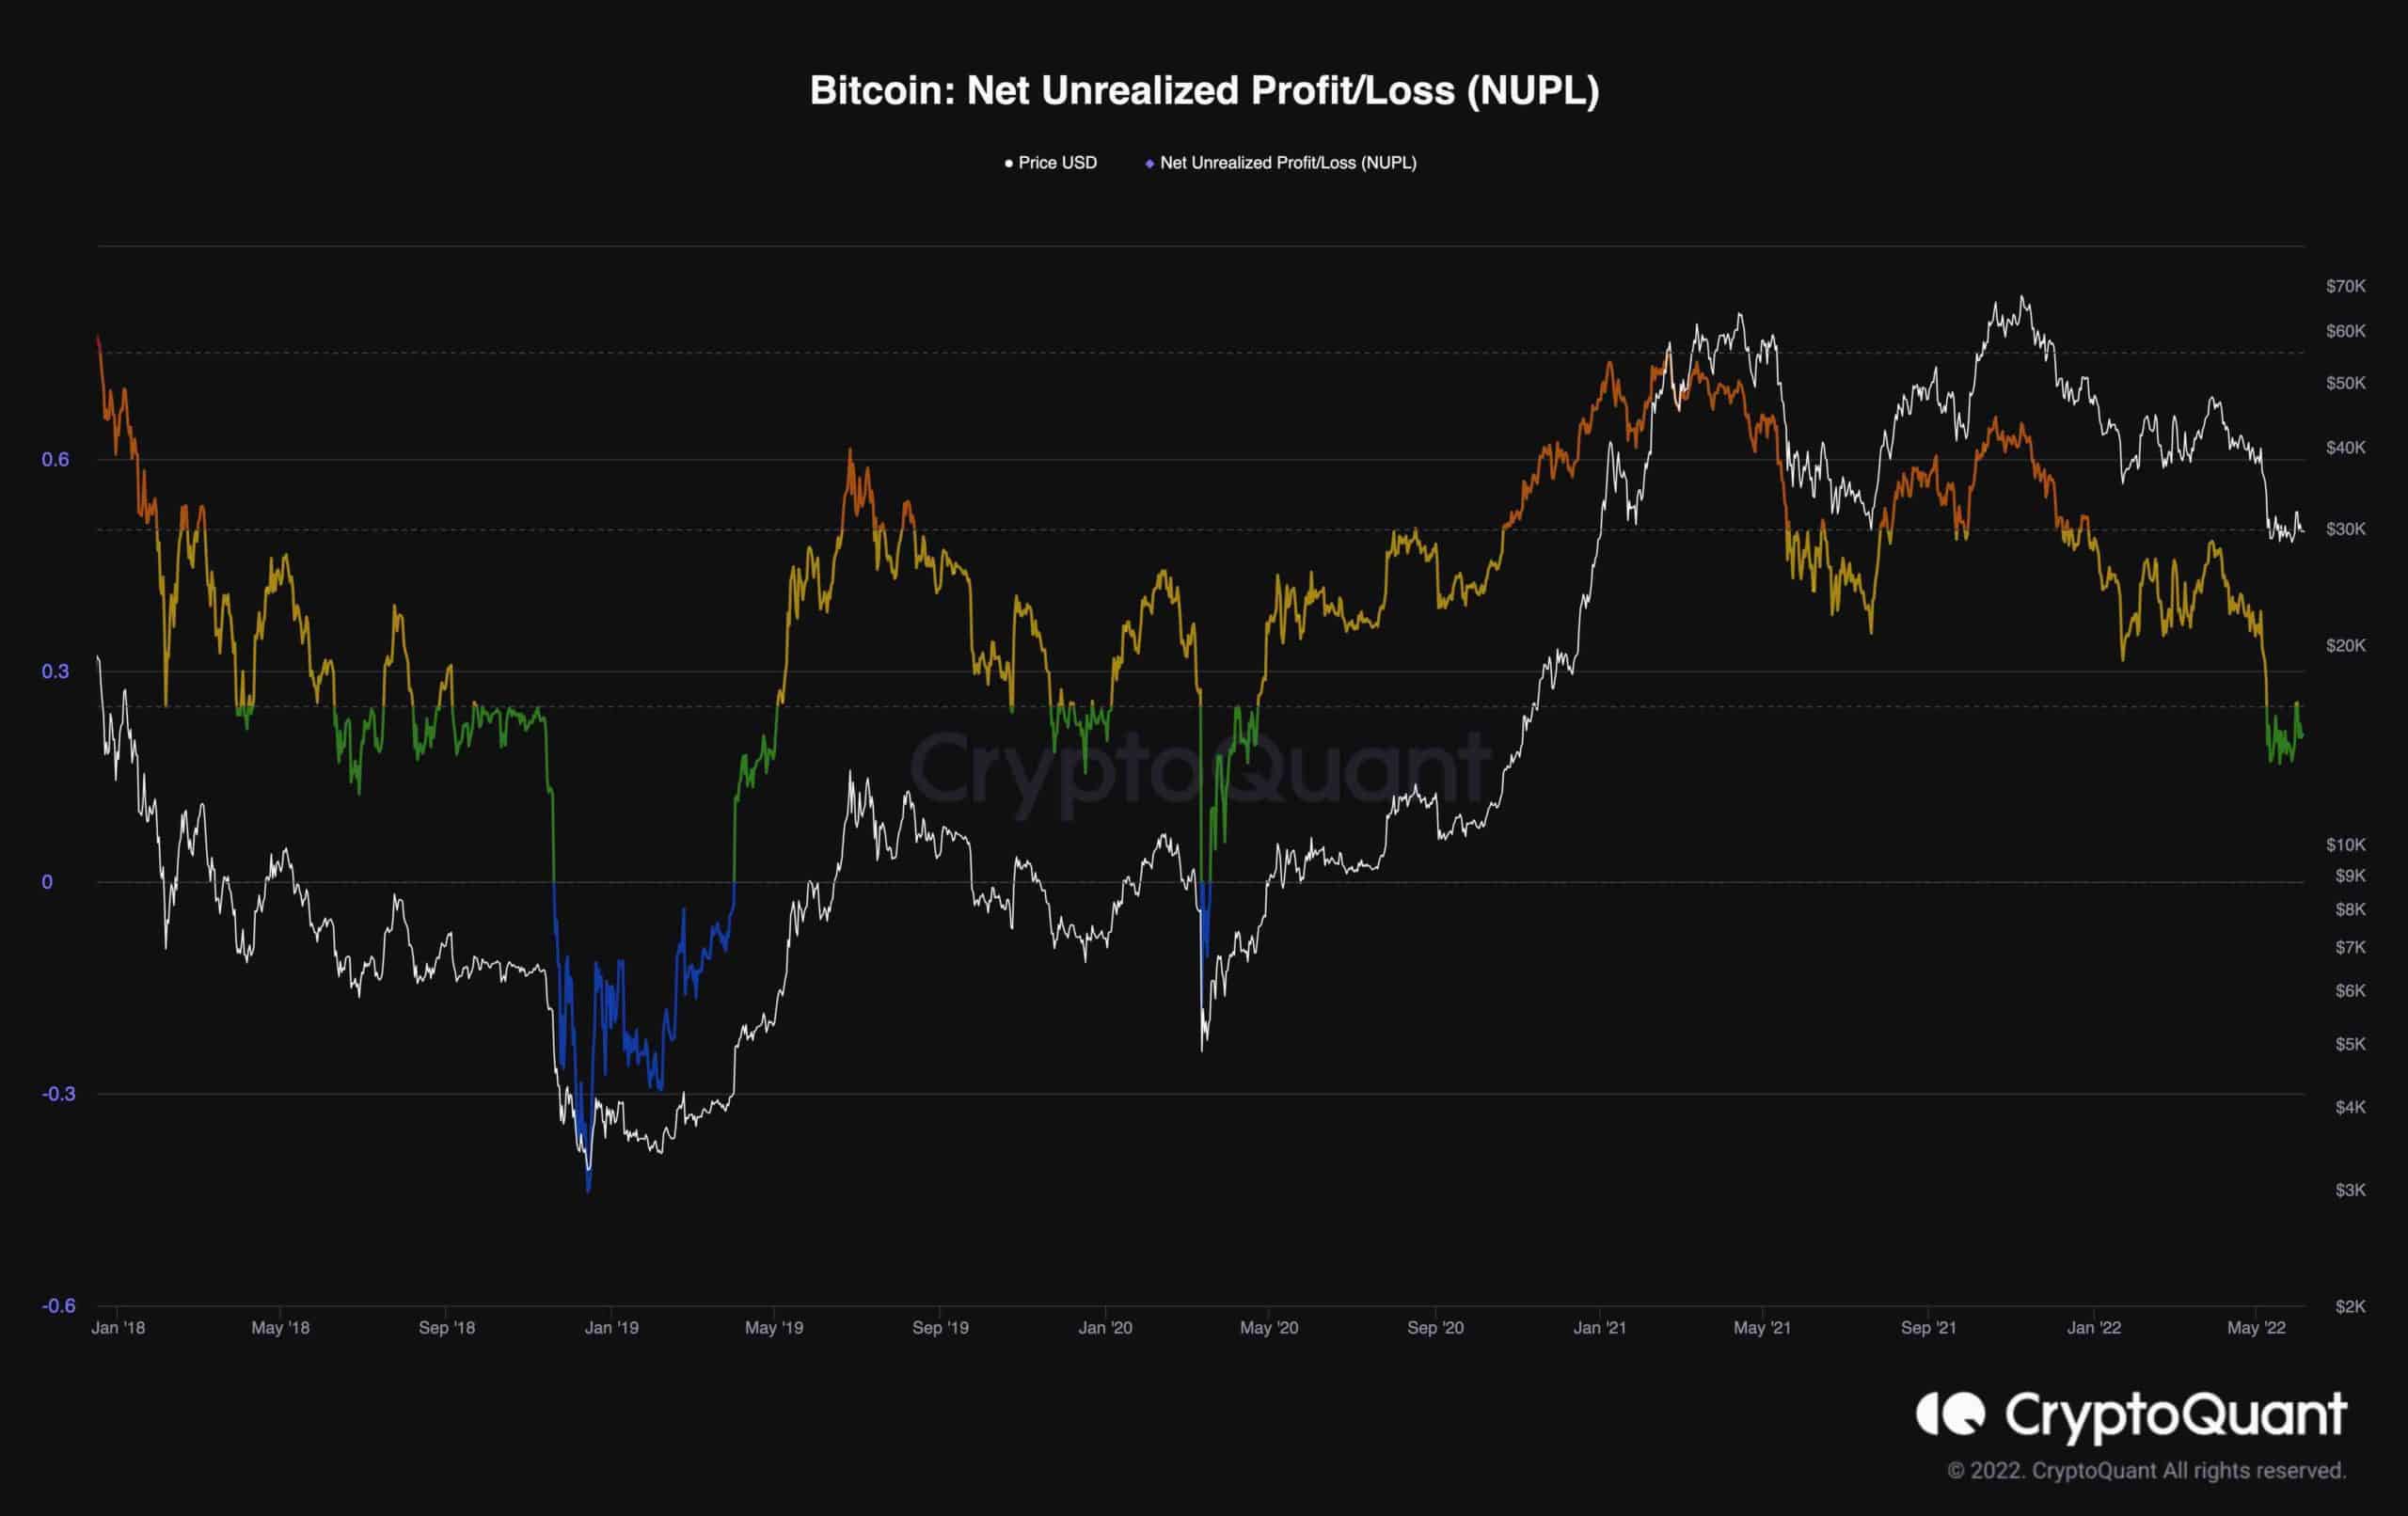