Despite the current attempts to initiate a reversal, XRP bears continue to dominate the price action. However, it’s important to examine the potential reversal levels and how things may play out in the not-so-distant future.
Technical Analysis
By Grizzly
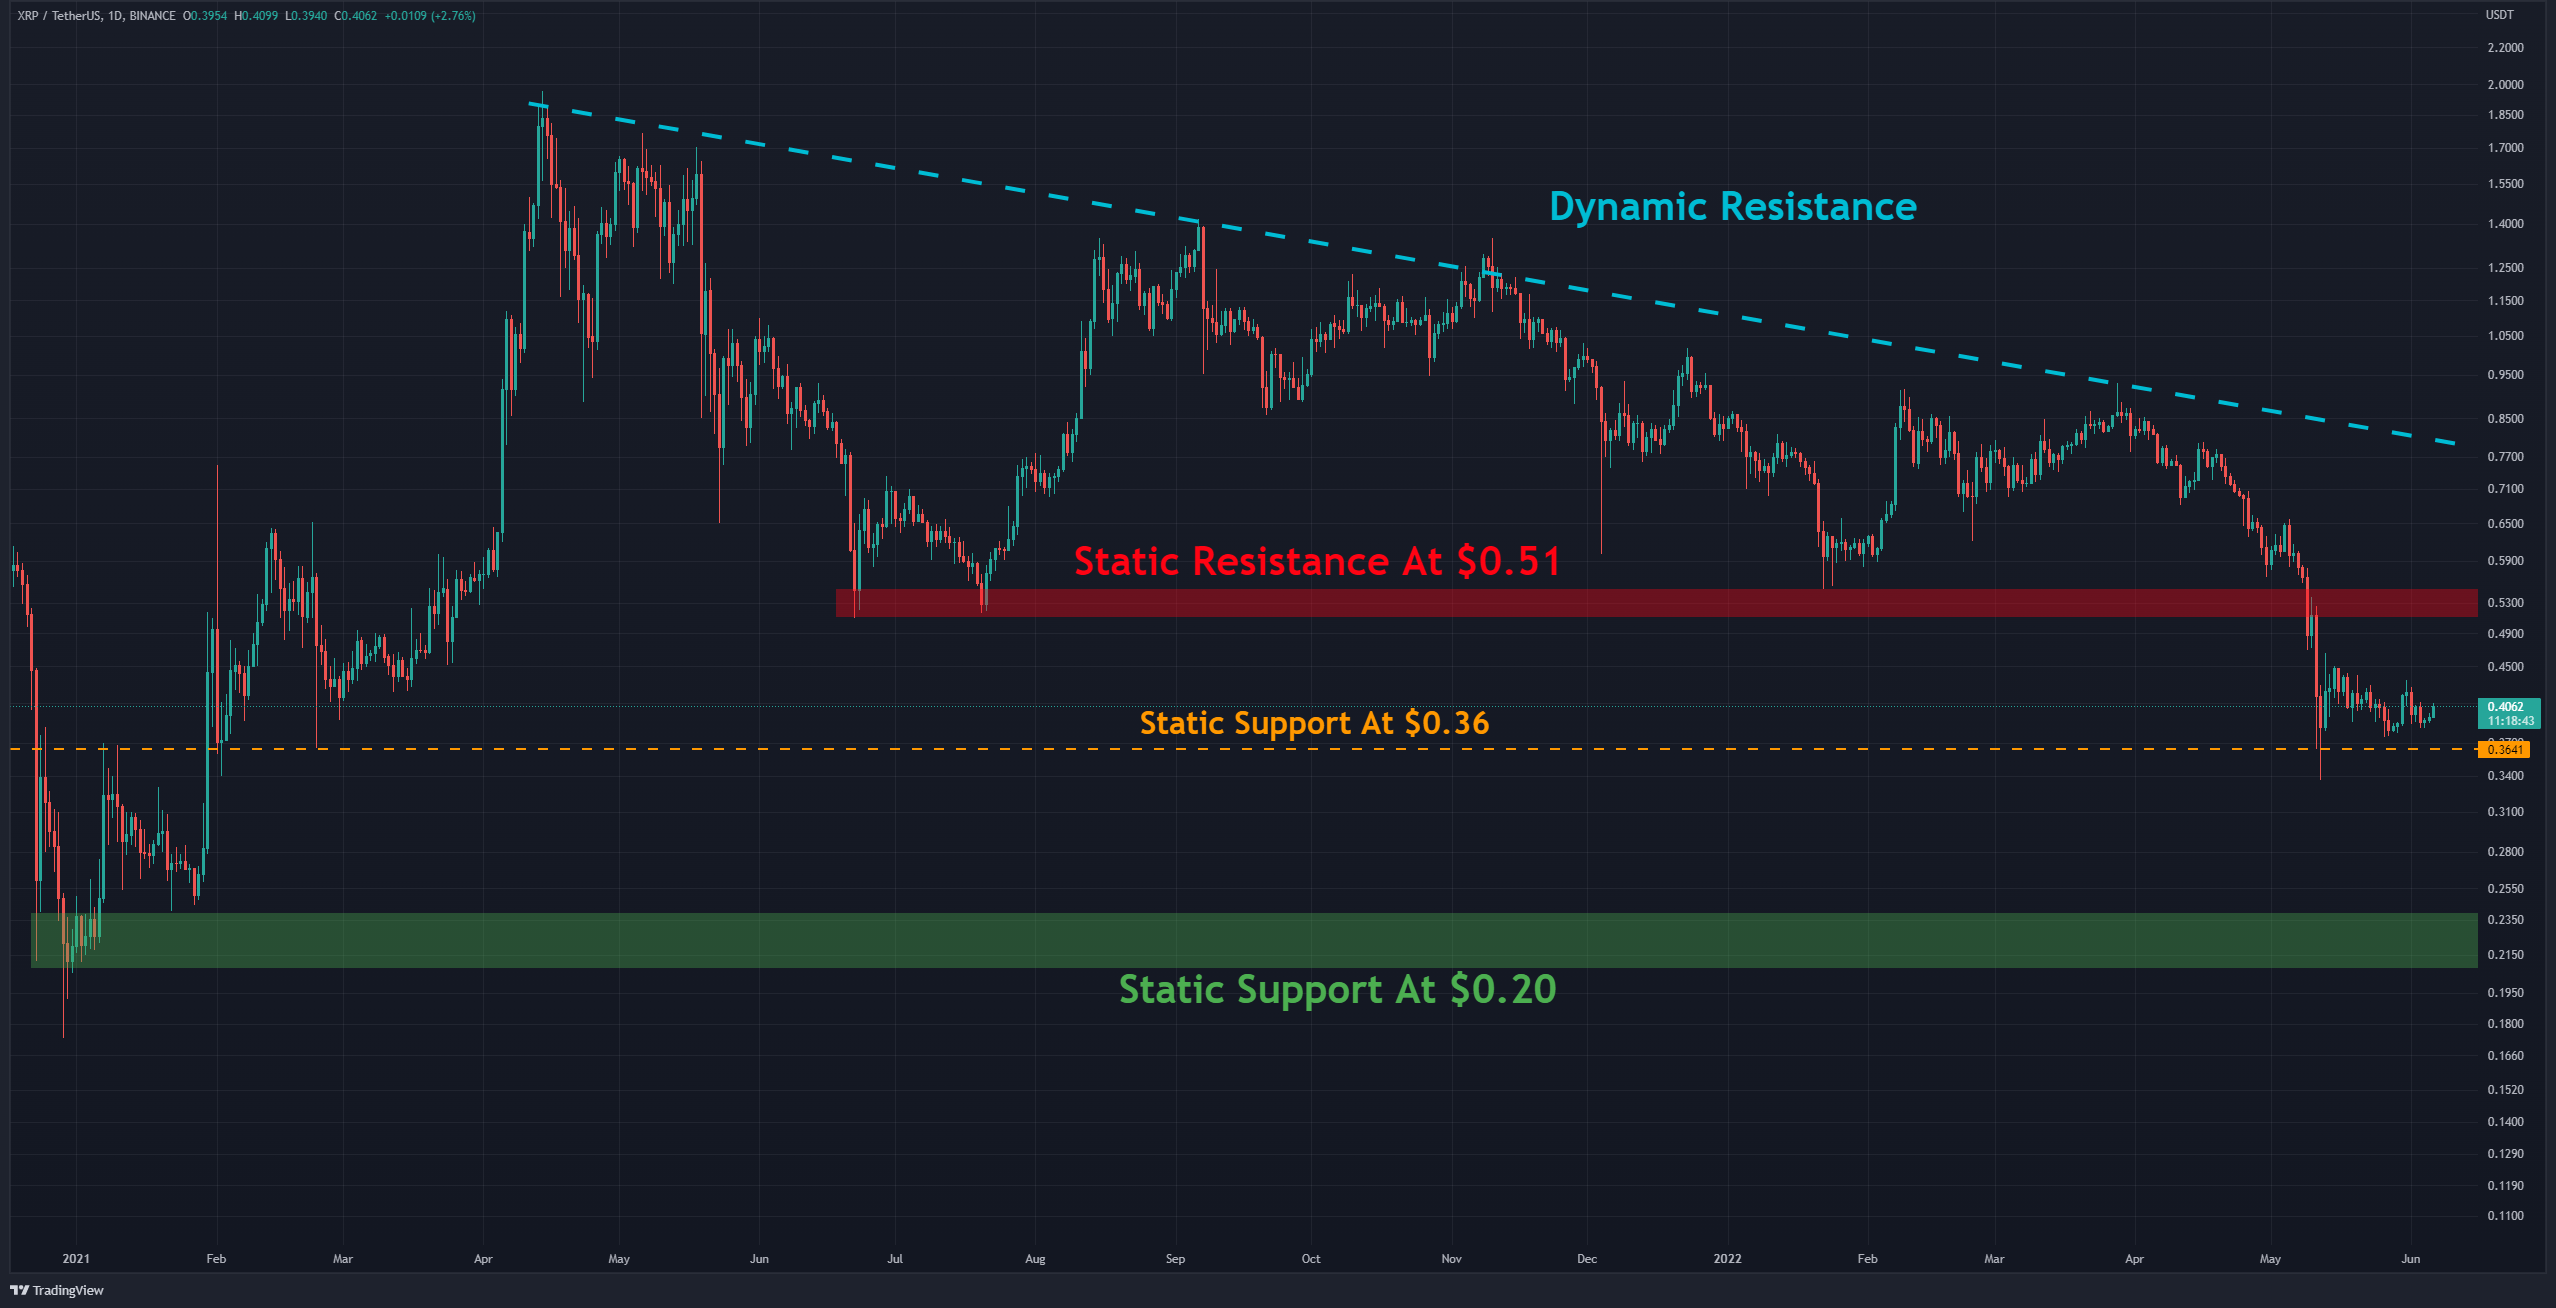
The Daily Chart
As seen on the daily timeframe, after the price attempted to increase on more than ten occasions from the beginning of January 2021 to August 2021, it has entered a correction phase, which has lasted more than 400 days so far. Ripple has lost more than 80% of its value during this time.
Despite the sharp fall in price, sellers still have the upper hand causing the current trend to remain bearish. The formation of the lower highs and lows confirms this scenario.
In order for the bulls to establish momentum, XRP needs to break above the following resistance barriers: first, the horizontal level of $0.51 (in red) and then cross the dynamic resistance (in blue). Provided this is taken care of, there would be more hope for a reversal, however, it remains a difficult task for the bulls.
Until the above scenario plays out, it’s hard to expect a new uptrend, and the overall outlook remains bearish.
Key Support Levels: $0.36 & $0.20
Key Resistance Levels: $0.44 & $0.51
Moving Averages:
MA20: $0.40
MA50: $0.52
MA100: $0.65
MA200: $0.73
The XRP/BTC Chart
The structure is quite bearish in the BTC pair chart, and XRP seems more inclined to move to the downside. The green candles look weak, and there is still no positive sign.
For an uptrend to emerge, the price against BTC should be able to return to the top of the red resistance zone at 1550 Sats. Taking back this level plays an essential role in continuing the uptrend. On the other hand, if buyers keep on dominating the market, reaching horizontal support at 1200 sats (white rectangle) is not out of the question. Given that this area is the intersection of horizontal (in blue) and dynamic (in yellow) support, the price has the potential to bounce back.
Key Support Levels: 1200 Sats & 1100 Sats
Key Resistance Levels: 1500 Sats & 1700 Sats