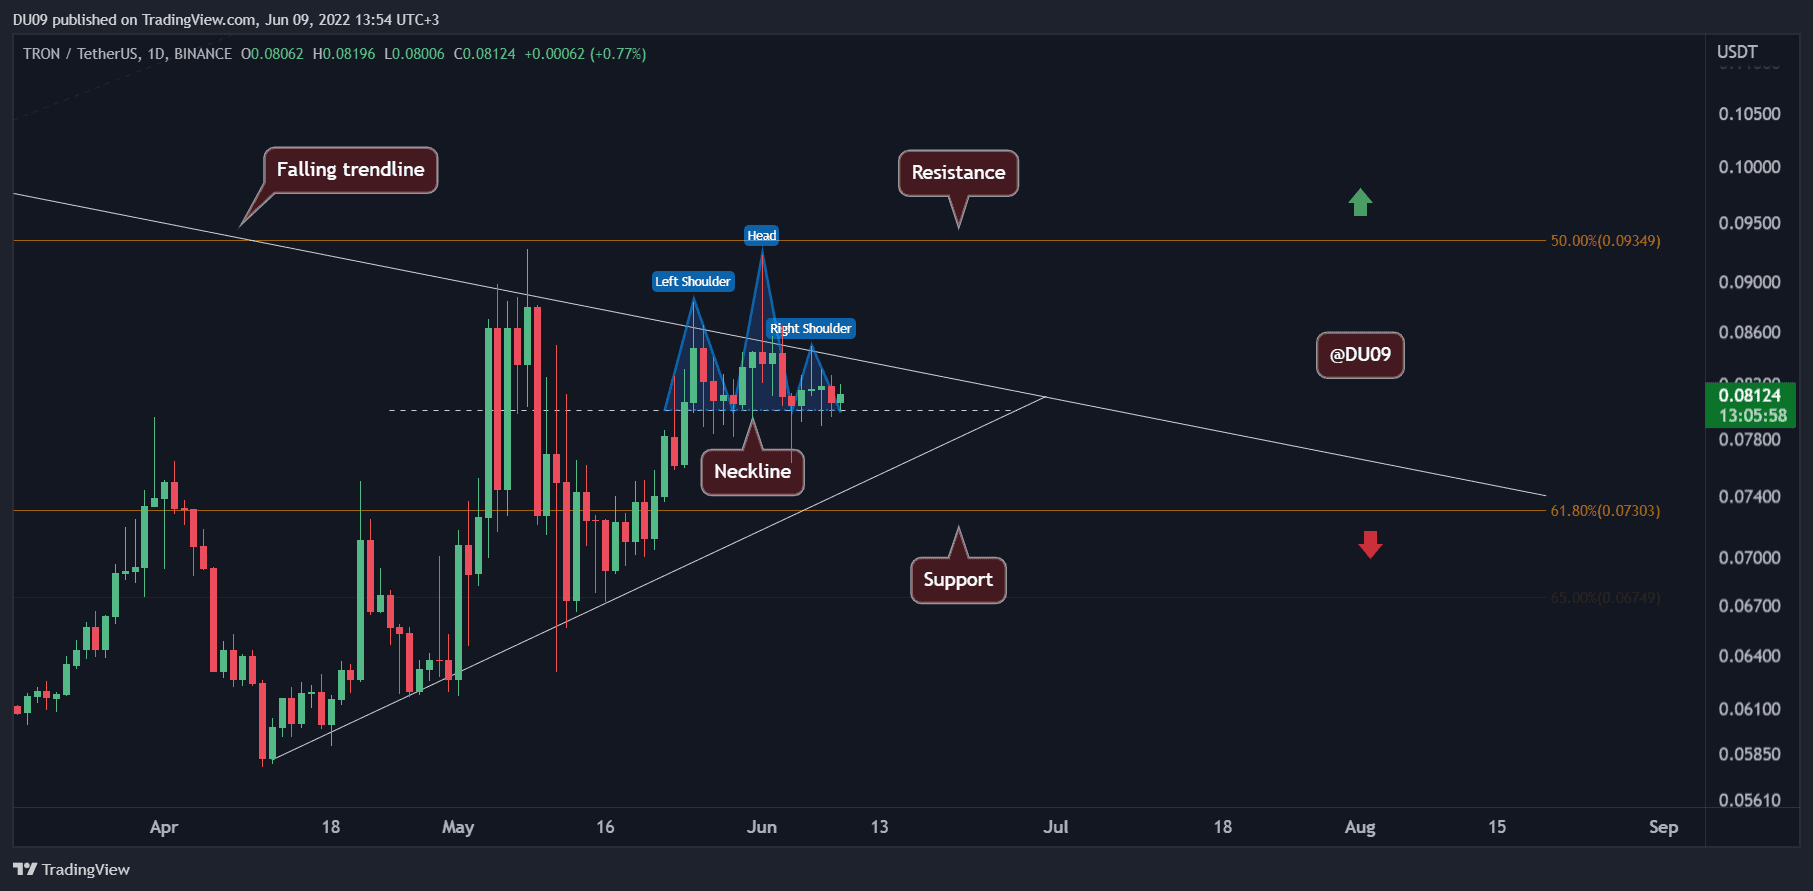
Tron appears to have formed a head and shoulders (H&S) formation after it failed to move above the key resistance following several attempts.
Key Support levels: $0.08, $0.07
Key Resistance levels: $0.085, $0.09
Should Tron’s price fall below the H&S neckline (represented in blue on the chart), then a retest of the key support at $0.07 becomes more likely. So far, the cryptocurrency has failed to move above the falling trendline that acts as resistance and spans all the way to the all-time high from April 2021. Turning the critical resistance at $0.085 into support would invalidate this structure.
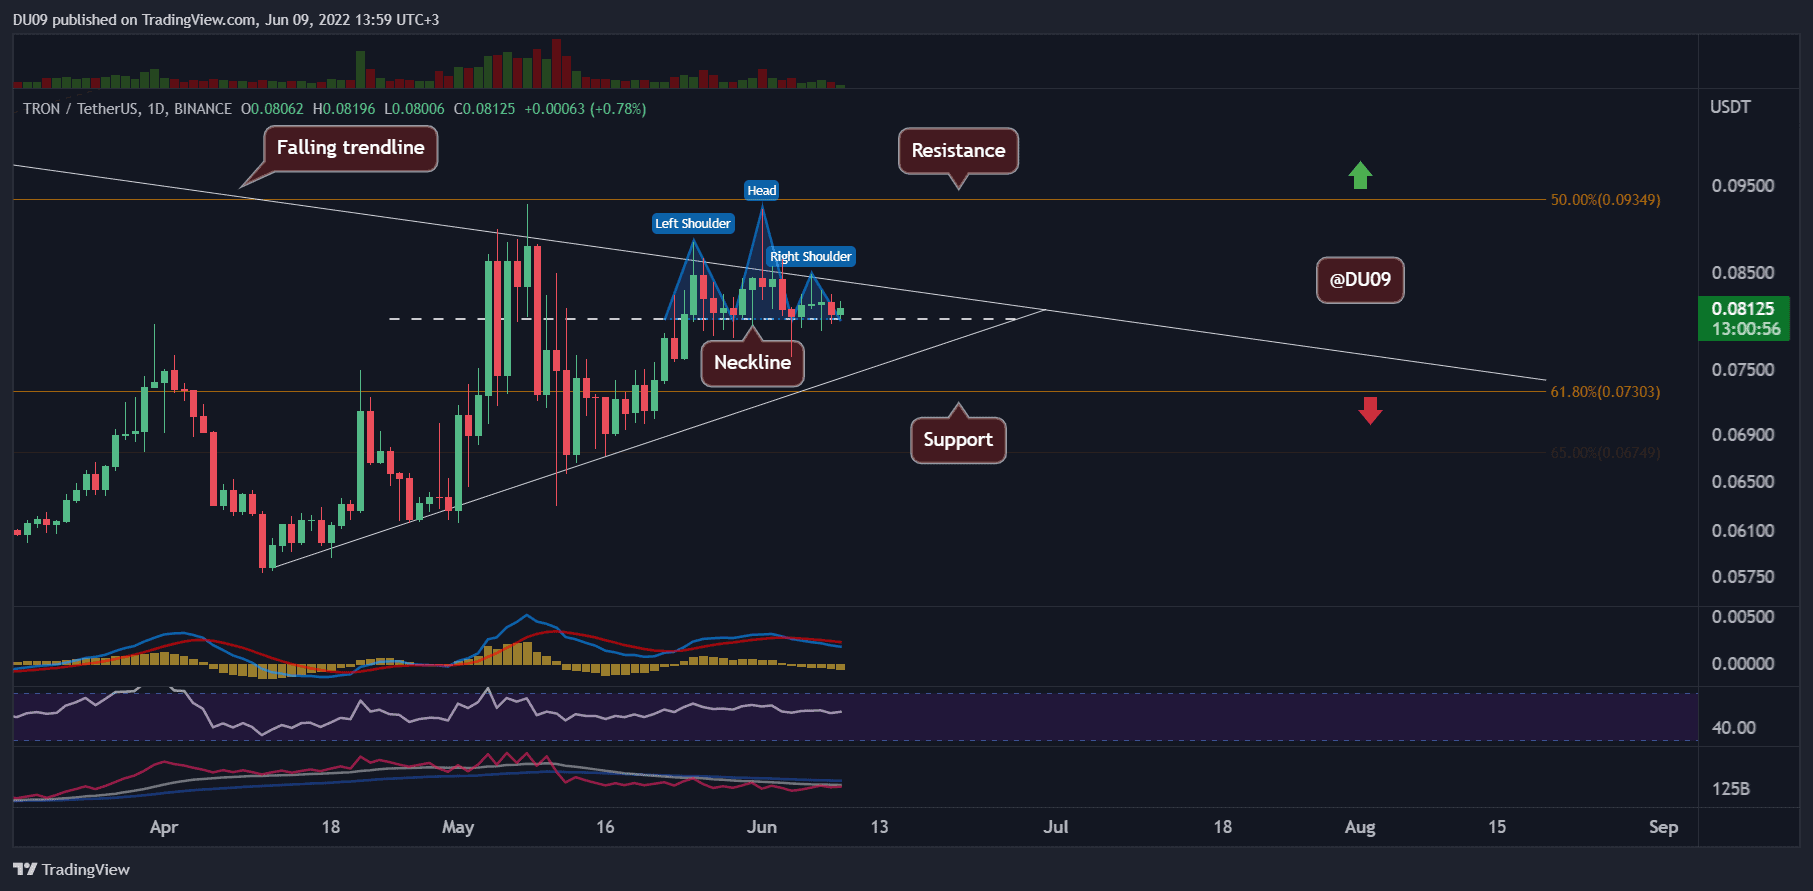
Technical Indicators
Trading Volume: The volume has been falling in the past weeks. This may give bears an opportunity to push the price lower.
RSI: The daily RSI is flat but managed to stay above 50 points. So long as the RSI continues to make higher lows, the bull case for TRX cannot be excluded.
MACD: The daily MACD is bearish, but the selling momentum is not strong – as evidenced by the histogram.
Bias
The bias for TRX is neutral. The price has to fall below 0.08$ to turn bearish.
Short-Term Prediction for TRX Price
Tron has been searching for a direction in the past week, and any attempts to break higher were quickly rejected. So far, the key resistance at $0.085 has managed to keep bulls in check. Should momentum fail to improve, then bears could take over and push the price back to the critical support at $0.07.