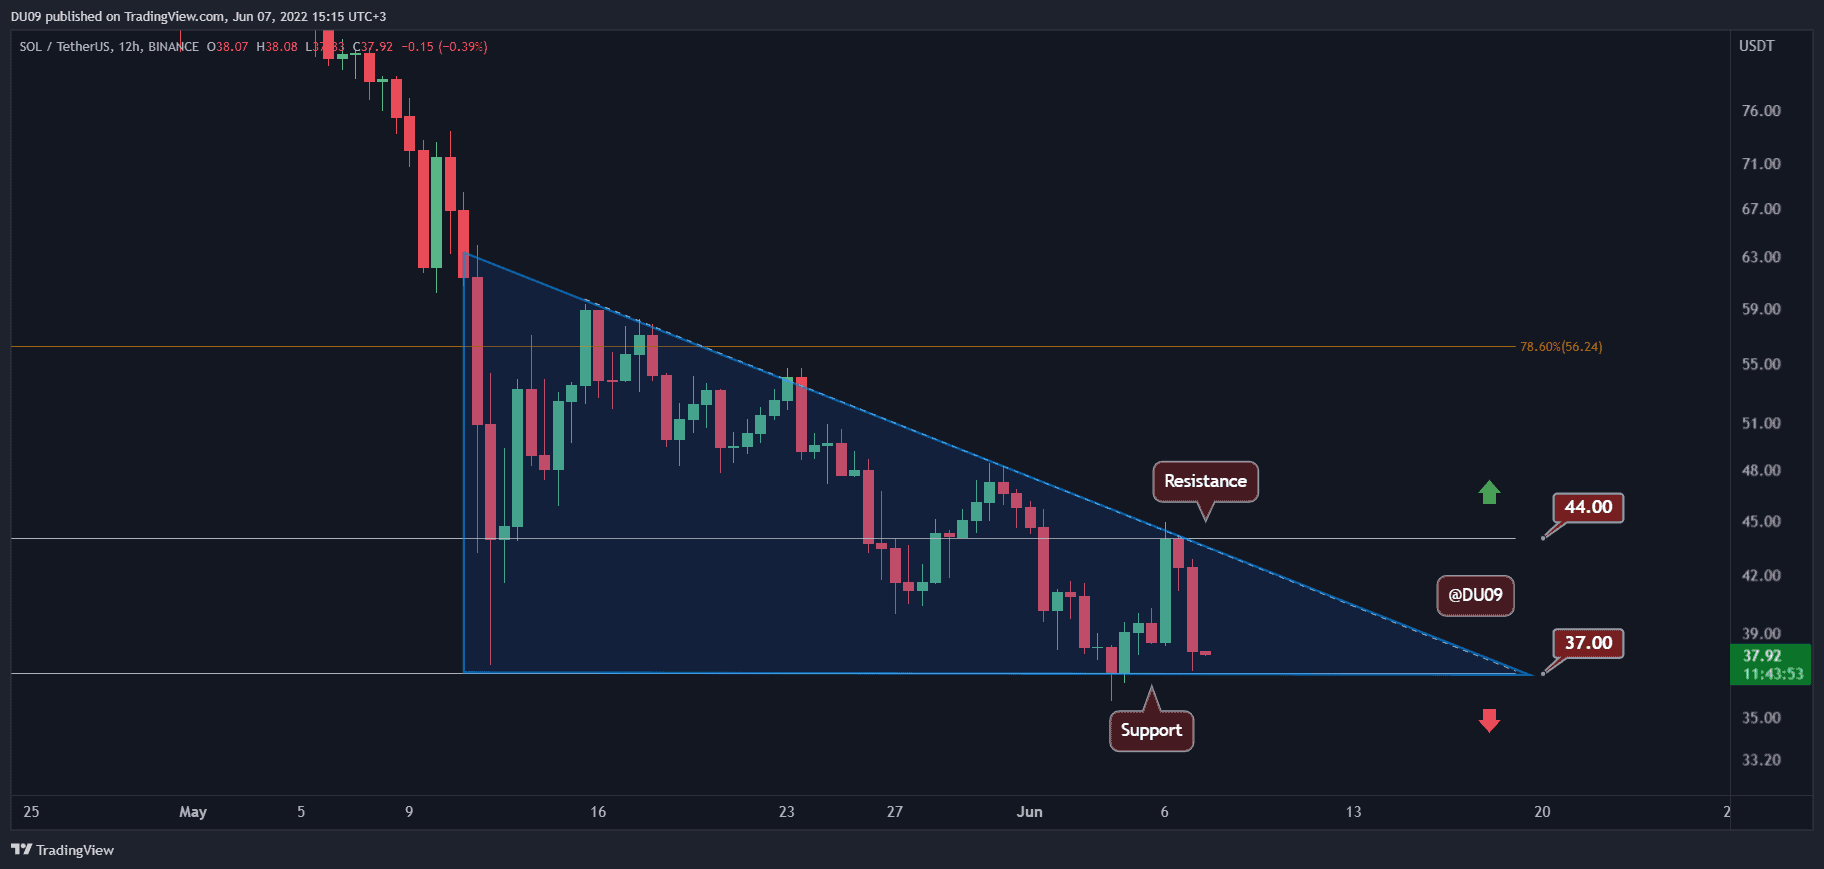
Solana is inching closer to a critical point, which, if breached, can take the price all the way down to $30.
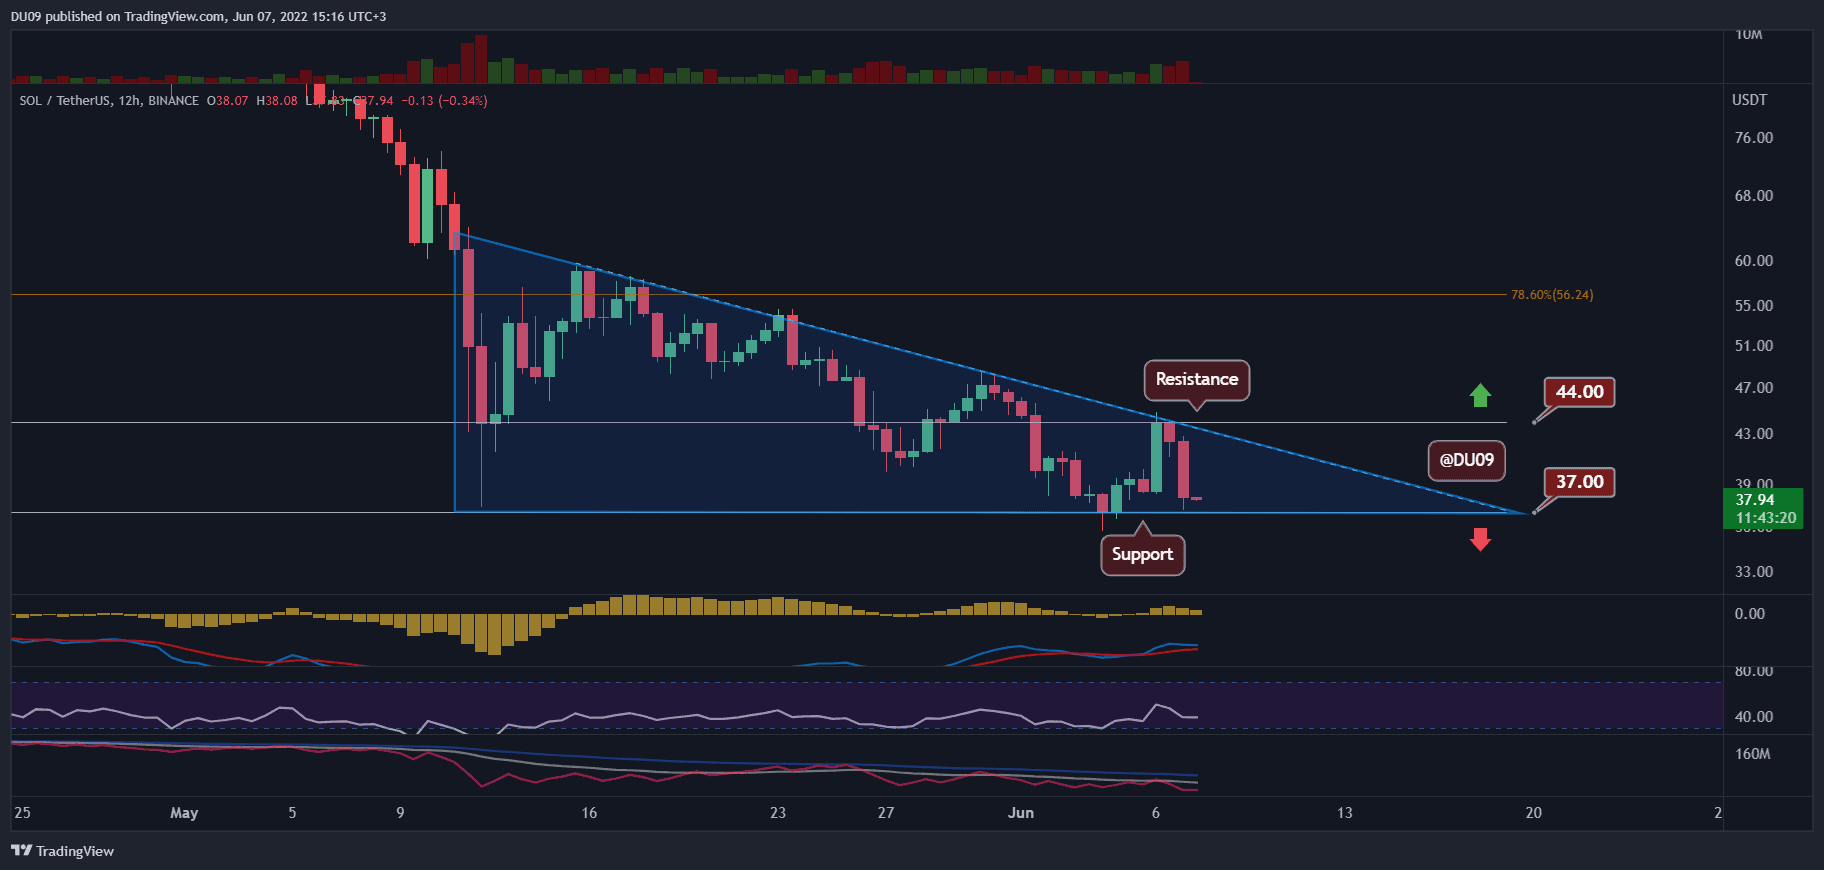
Key Support levels: $37
Key Resistance levels: $44
The price action has formed a large descending triangle (represented in blue on the below chart). If the price breaks below the current support at $37, then Solana will be more likely to continue decreasing towards $30. The current resistance is at $44 and it doesn’t seem very probable for the price to revisit this level considering the market.
Technical Indicators
Trading Volume: The volume actually picked up as Solana’s price fell. This is a bearish signal.
RSI: The daily RSI did not even manage to reach 40 points. For this reason, the trend remains very much bearish.
MACD: The daily MACD is bullish, but the histogram is flat. This indicates there is no momentum for bulls.
Bias
The bias for SOL is bearish. If the key support holds, then the cryptocurrency may have a chance to avoid another crash.
Short-Term Prediction for SOL Price
With the price at a pivotal point, SOL will soon have to decide which way to go next. The descending triangle is about to be broken and the current indicators give a bearish bias. If this materializes and the cryptocurrency falls under $37, then it’s likely for much lower levels to come into play.