Ripple appeared weak in the last two weeks following the sharp fall in early May. The ongoing price action, however, indicates the current sideways is more likely to be leaning to the downside.
Technical Analysis
By Grizzly
The Daily Chart
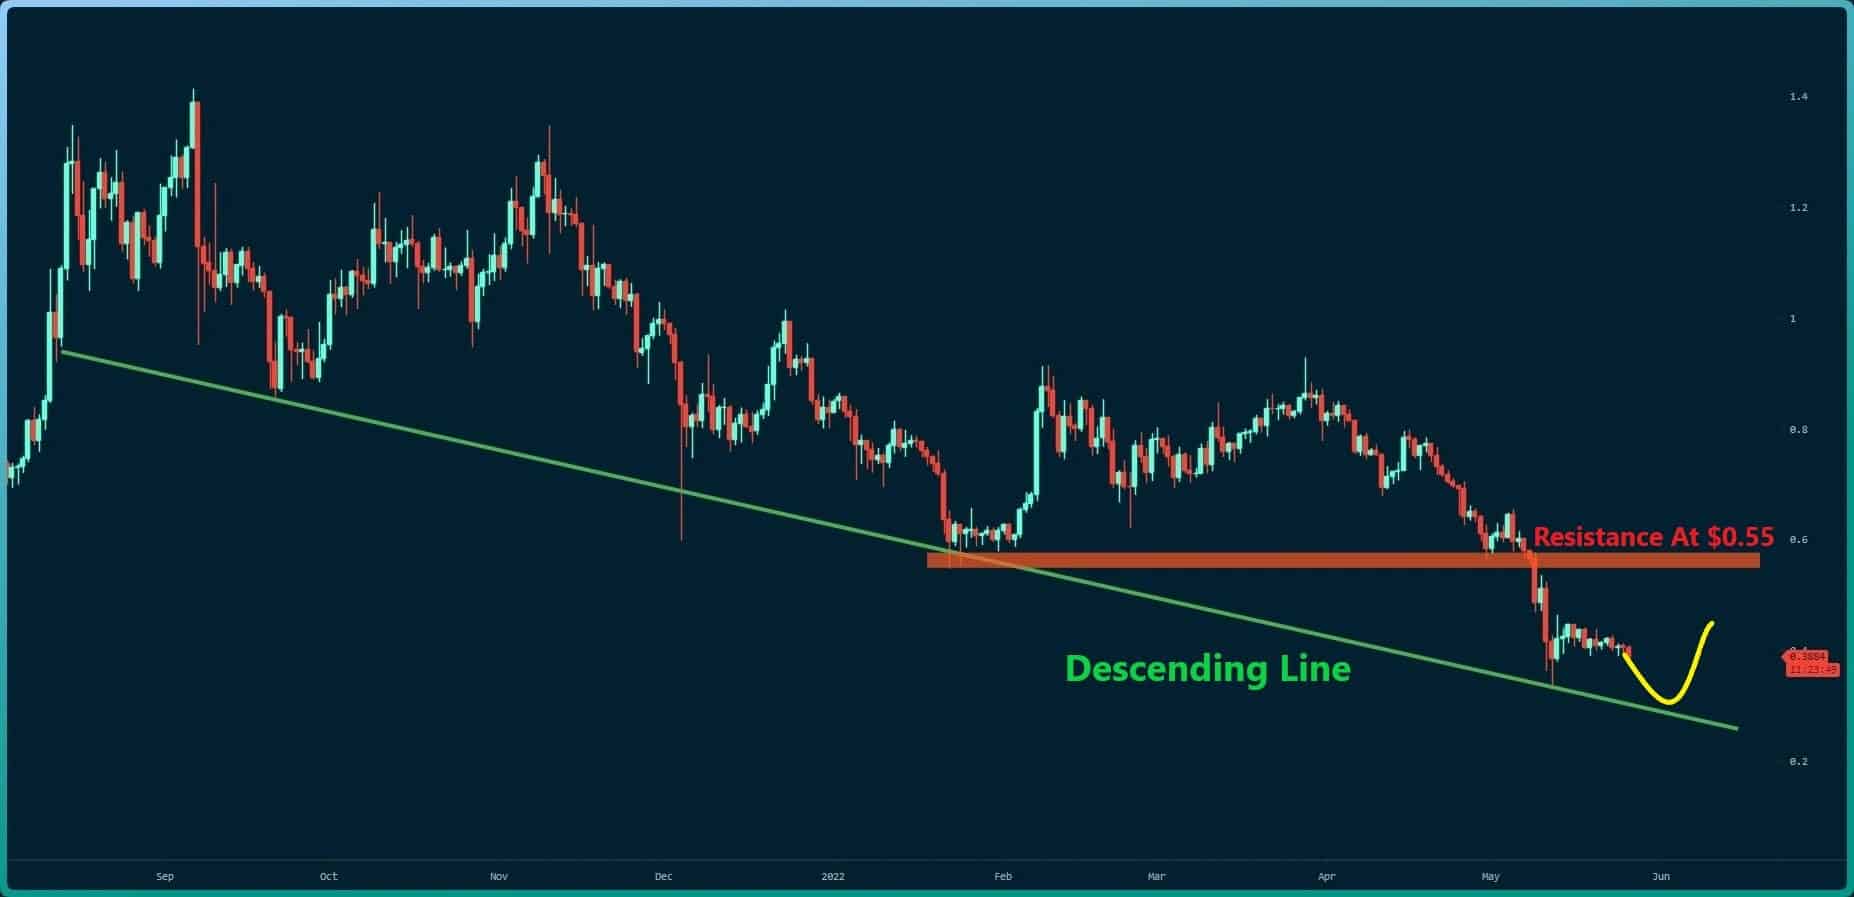
On the daily timeframe, the horizontal resistance at $0.45 has halted any upward momentum, and buyers have not been able to push and, subsequently – consolidate the price above it. The fear in the market has intensified the weakness in the trend, and there are currently no meaningful bullish signs.
If the bears push the price down again, the descending line (in green), which acts as support, will likely be touched at around $0.3. If this happens, then a short-term relief bounce might also take place.
But suppose buyers enter the market and are able to close a daily candle above $0.45. The probability that XRP will move towards the horizontal resistance at $0.55 (in red) would be high from a technical perspective.
Key Support Levels: $0.33 & $0.24 & $0.17
Key Resistance Levels: $0.45 & $0.55 & $0.65
Moving Averages:
MA20: $0.44
MA50: $0.59
MA100: $0.69
MA200: $0.77
XRP/BTC Chart
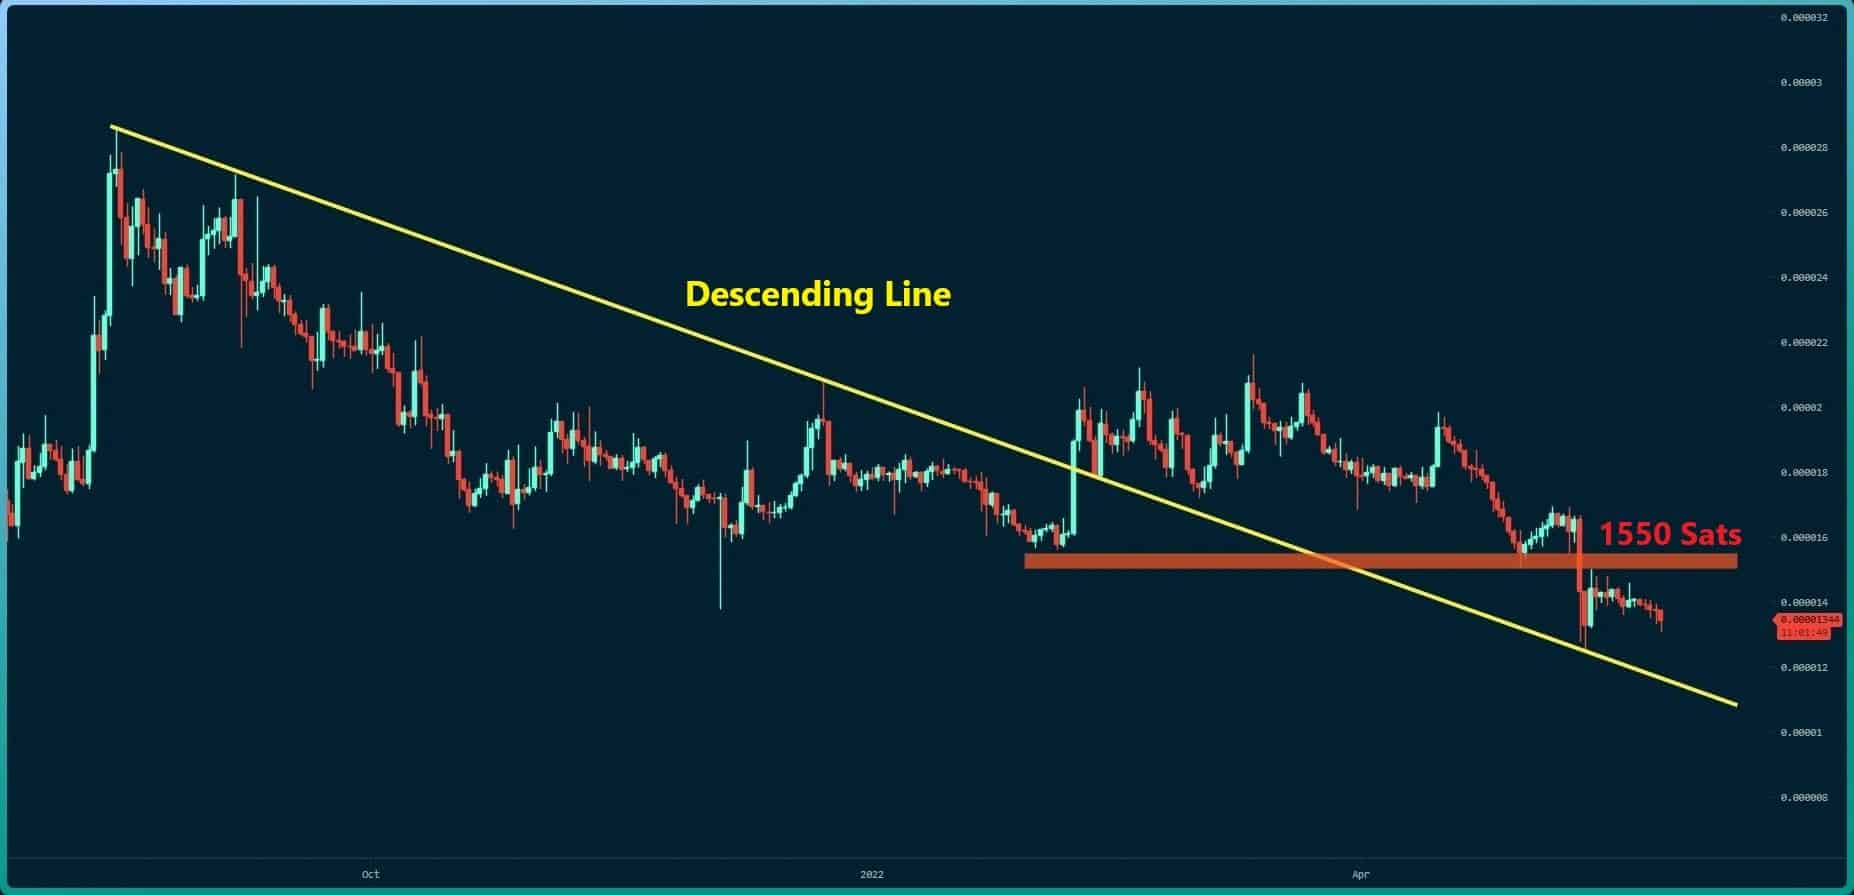
The XRP/BTC chart is analogous to the USD one. The price trades below a horizontal level and on a descending line (in yellow). The price action in the past few days strongly indicates that the bearish trend doesn’t seem to be weakening.
If the situation remains unchanged, the price will likely touch the descending line again around 1100 Sats. To get out of this trend, the cryptocurrency needs to reach the top of the horizontal resistance at 1550 Sats (in red) and close above it to reduce the downward momentum.