It’s becoming more evident that bears have absolutely no intention of retreating. They reacted strongly to the upward movement in the past three days, and the price was once again pushed towards the critical support at $1700.
Technical Analysis
By Grizzly
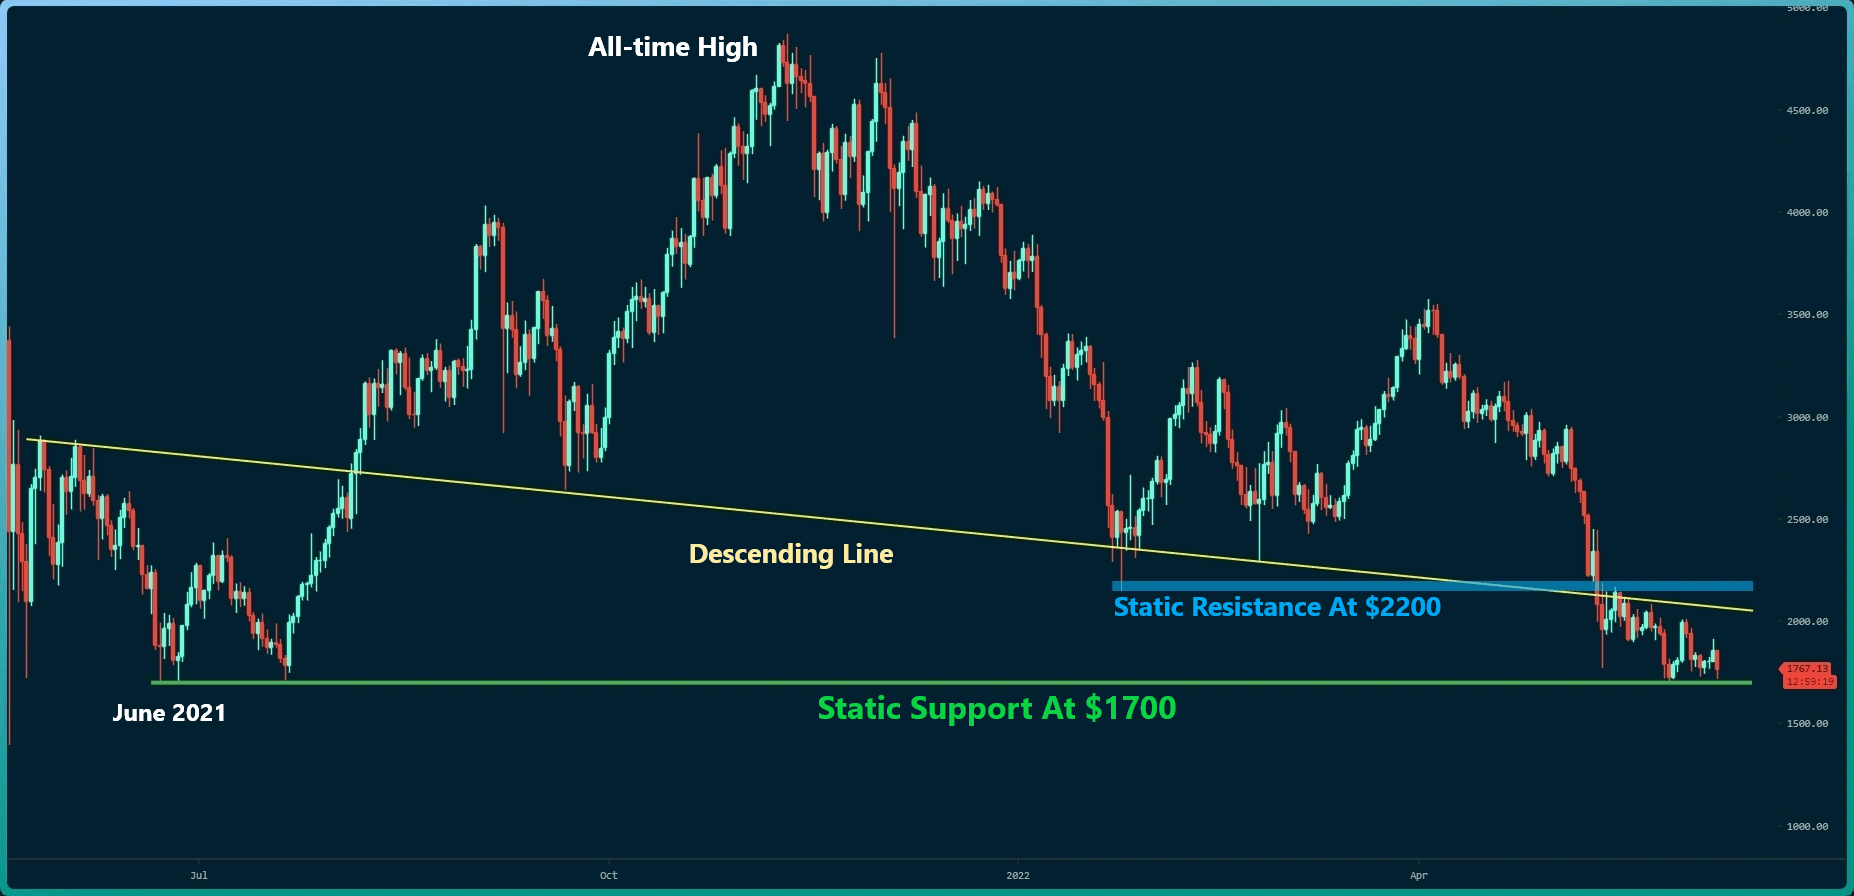
The Daily Chart
As seen in the daily chart, the horizontal support at $1,700 (in green) has accompanied the price since June last year. Now, ETH is back trading at this support once again. Breaking above it in July 2021 was the starting point of the upward trend toward the all-time high.
However, the market structure and the macro environment are very different now. The bulls have not even been able to form a higher high yet, and the weakness in the market is evident. For any chance at a bullish reversal, two things must happen.
The first is to break above the descending line (in yellow) and then consolidate above the horizontal resistance at $2200 (in blue). This would result in the formation of a bullish structure with a higher high.
On the other hand – if bears take control (and this seems more likely ) and push the price below the green area, then the demand zone between $1300 and $1500 will be the next battlefield.
Key Support Levels: $1700 & $1500
Key Resistance Levels: $2200 & $2400
Moving Averages:
MA20: $1880
MA50: $2312
MA100: $2653
MA200: $3050
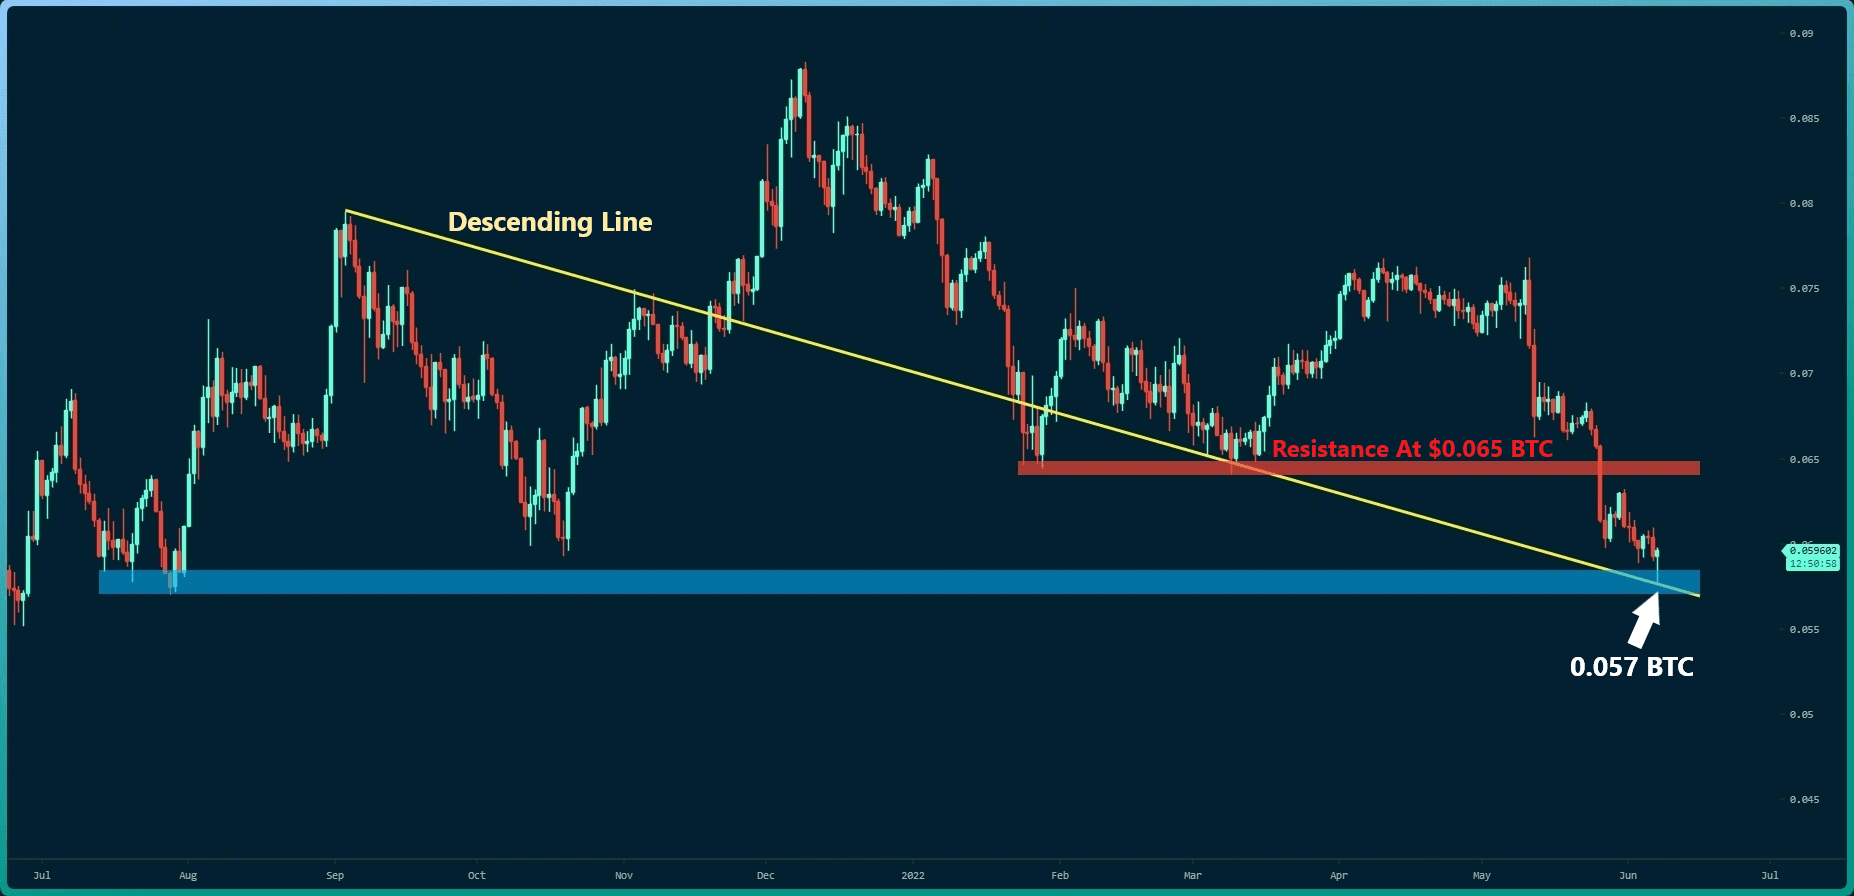
The ETH/BTC Chart
Against BTC, the intersection of the descending line (in yellow) and the horizontal support at 0.057 BTC (in blue) has acted as a support level and prevented further price corrections.
The structure of this chart is very similar to the USD pair. Due to the formation of lower highs and lows, the overall picture is considered bearish until the price can reach above the horizontal resistance at 0.065 BTC.
Key Support Levels: 0.060 BTC & 0.055 BTC
Key Resistance Levels: 0.065 BTC & 0.070 BTC
Sentiment Analysis
Coinbase Premium Index
Definition: The percent difference between the Coinbase Pro price (USD pair) and Binance price(USDT pair).
High premium values could indicate US investors’ strong buying pressure in Coinbase.
An unprecedented event has occurred in this chart. This index is below the baseline (or Zero line) and has reached one of its lowest levels since the COVID crash. This shows that US investors are staying away from investing in ETH at the moment. This hypothesis can also be confirmed by the relatively lower withdrawal volume from the Coinbase exchange.