Yesterday, Ethereum charted a notable green candle. Despite hopes of a bullish reversal, there’s a critical necessity for the price to regain key levels to get any sort of confirmation for this.
Technical Analysis
By Grizzly
The Daily Chart
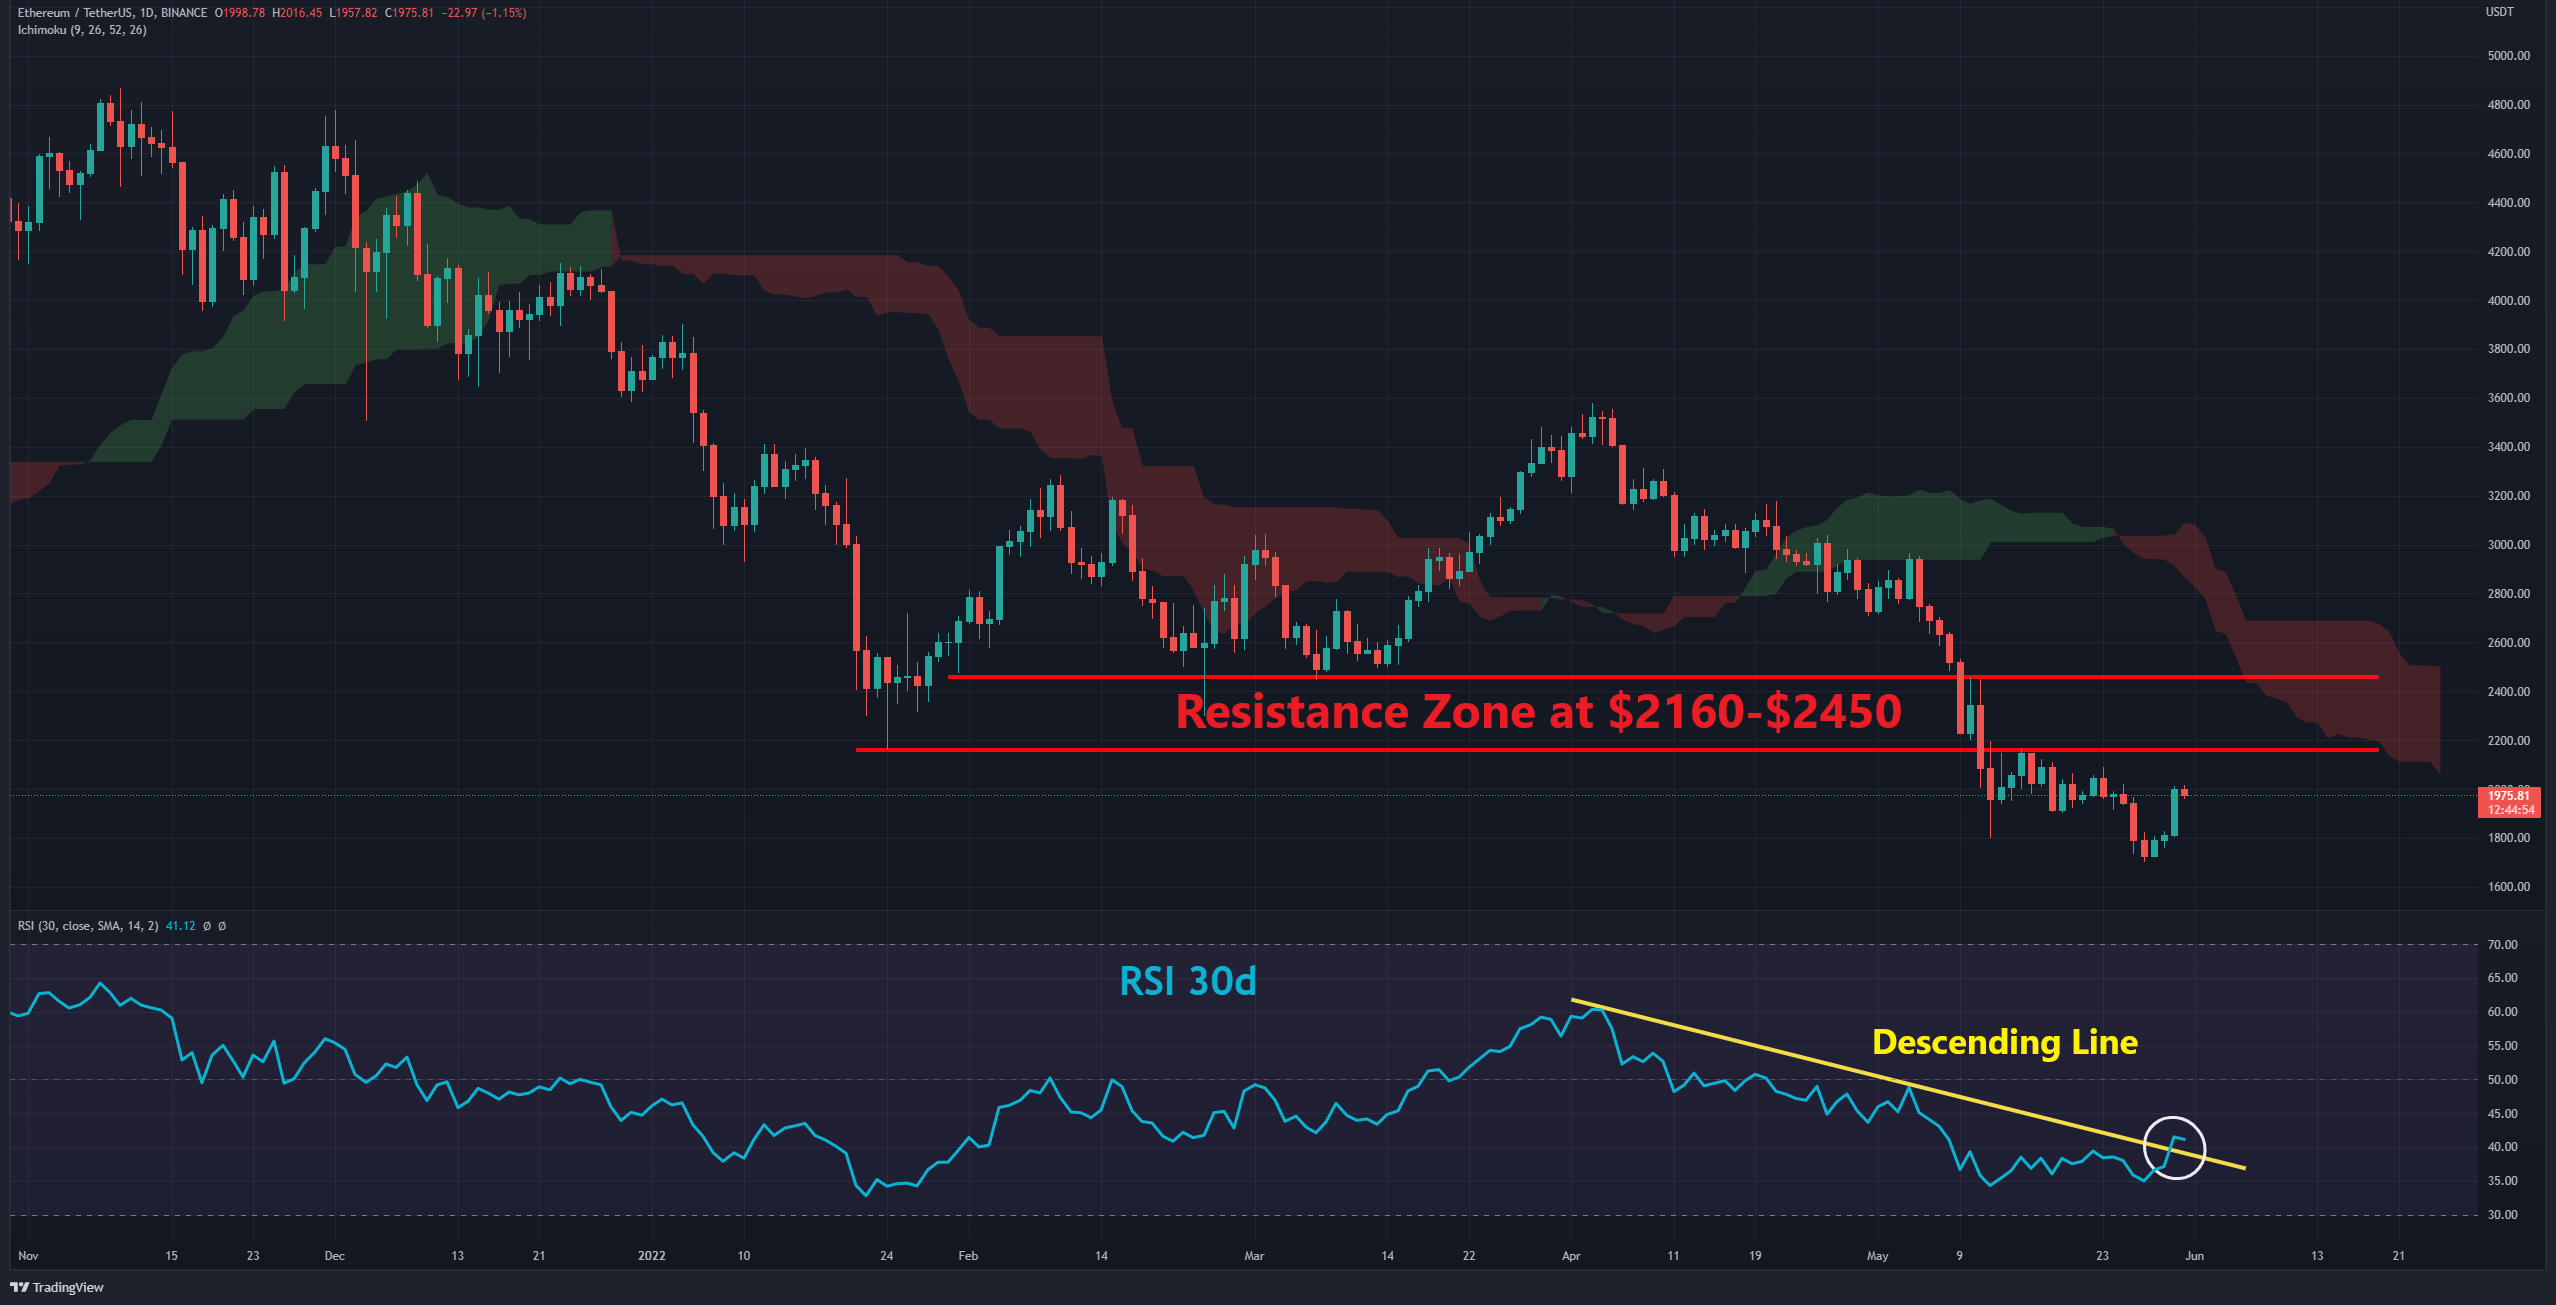
The bulls were able to defend the horizontal support at $1,700 on the daily timeframe. Over the past year, this level has played an important role for Ethereum. ETH could be on its way to a new bottom if sellers break below it.
As many significant support levels have been lost in the recent collapse, they’ve now turned into resistance, and the bulls must return to the top of the red zone at $2160-$2450. If they are successful, one can be more optimistic about the reversal of the trend.
It’s also important to note that any upward movement may be regarded as a pullback since the overall structure of the market remains bearish. Additionally, a thick red Ichimoku cloud is also located in this resistance zone as a barrier. Generally, buyers have faced strong opposition in cases like this.
Key Support Levels: $1700 & $1500
Key Resistance Levels: $2160 & $2450
Moving Averages:
MA20: $1959
MA50: $2486
MA100: $2713
MA200: $3140
The ETH/BTC Chart
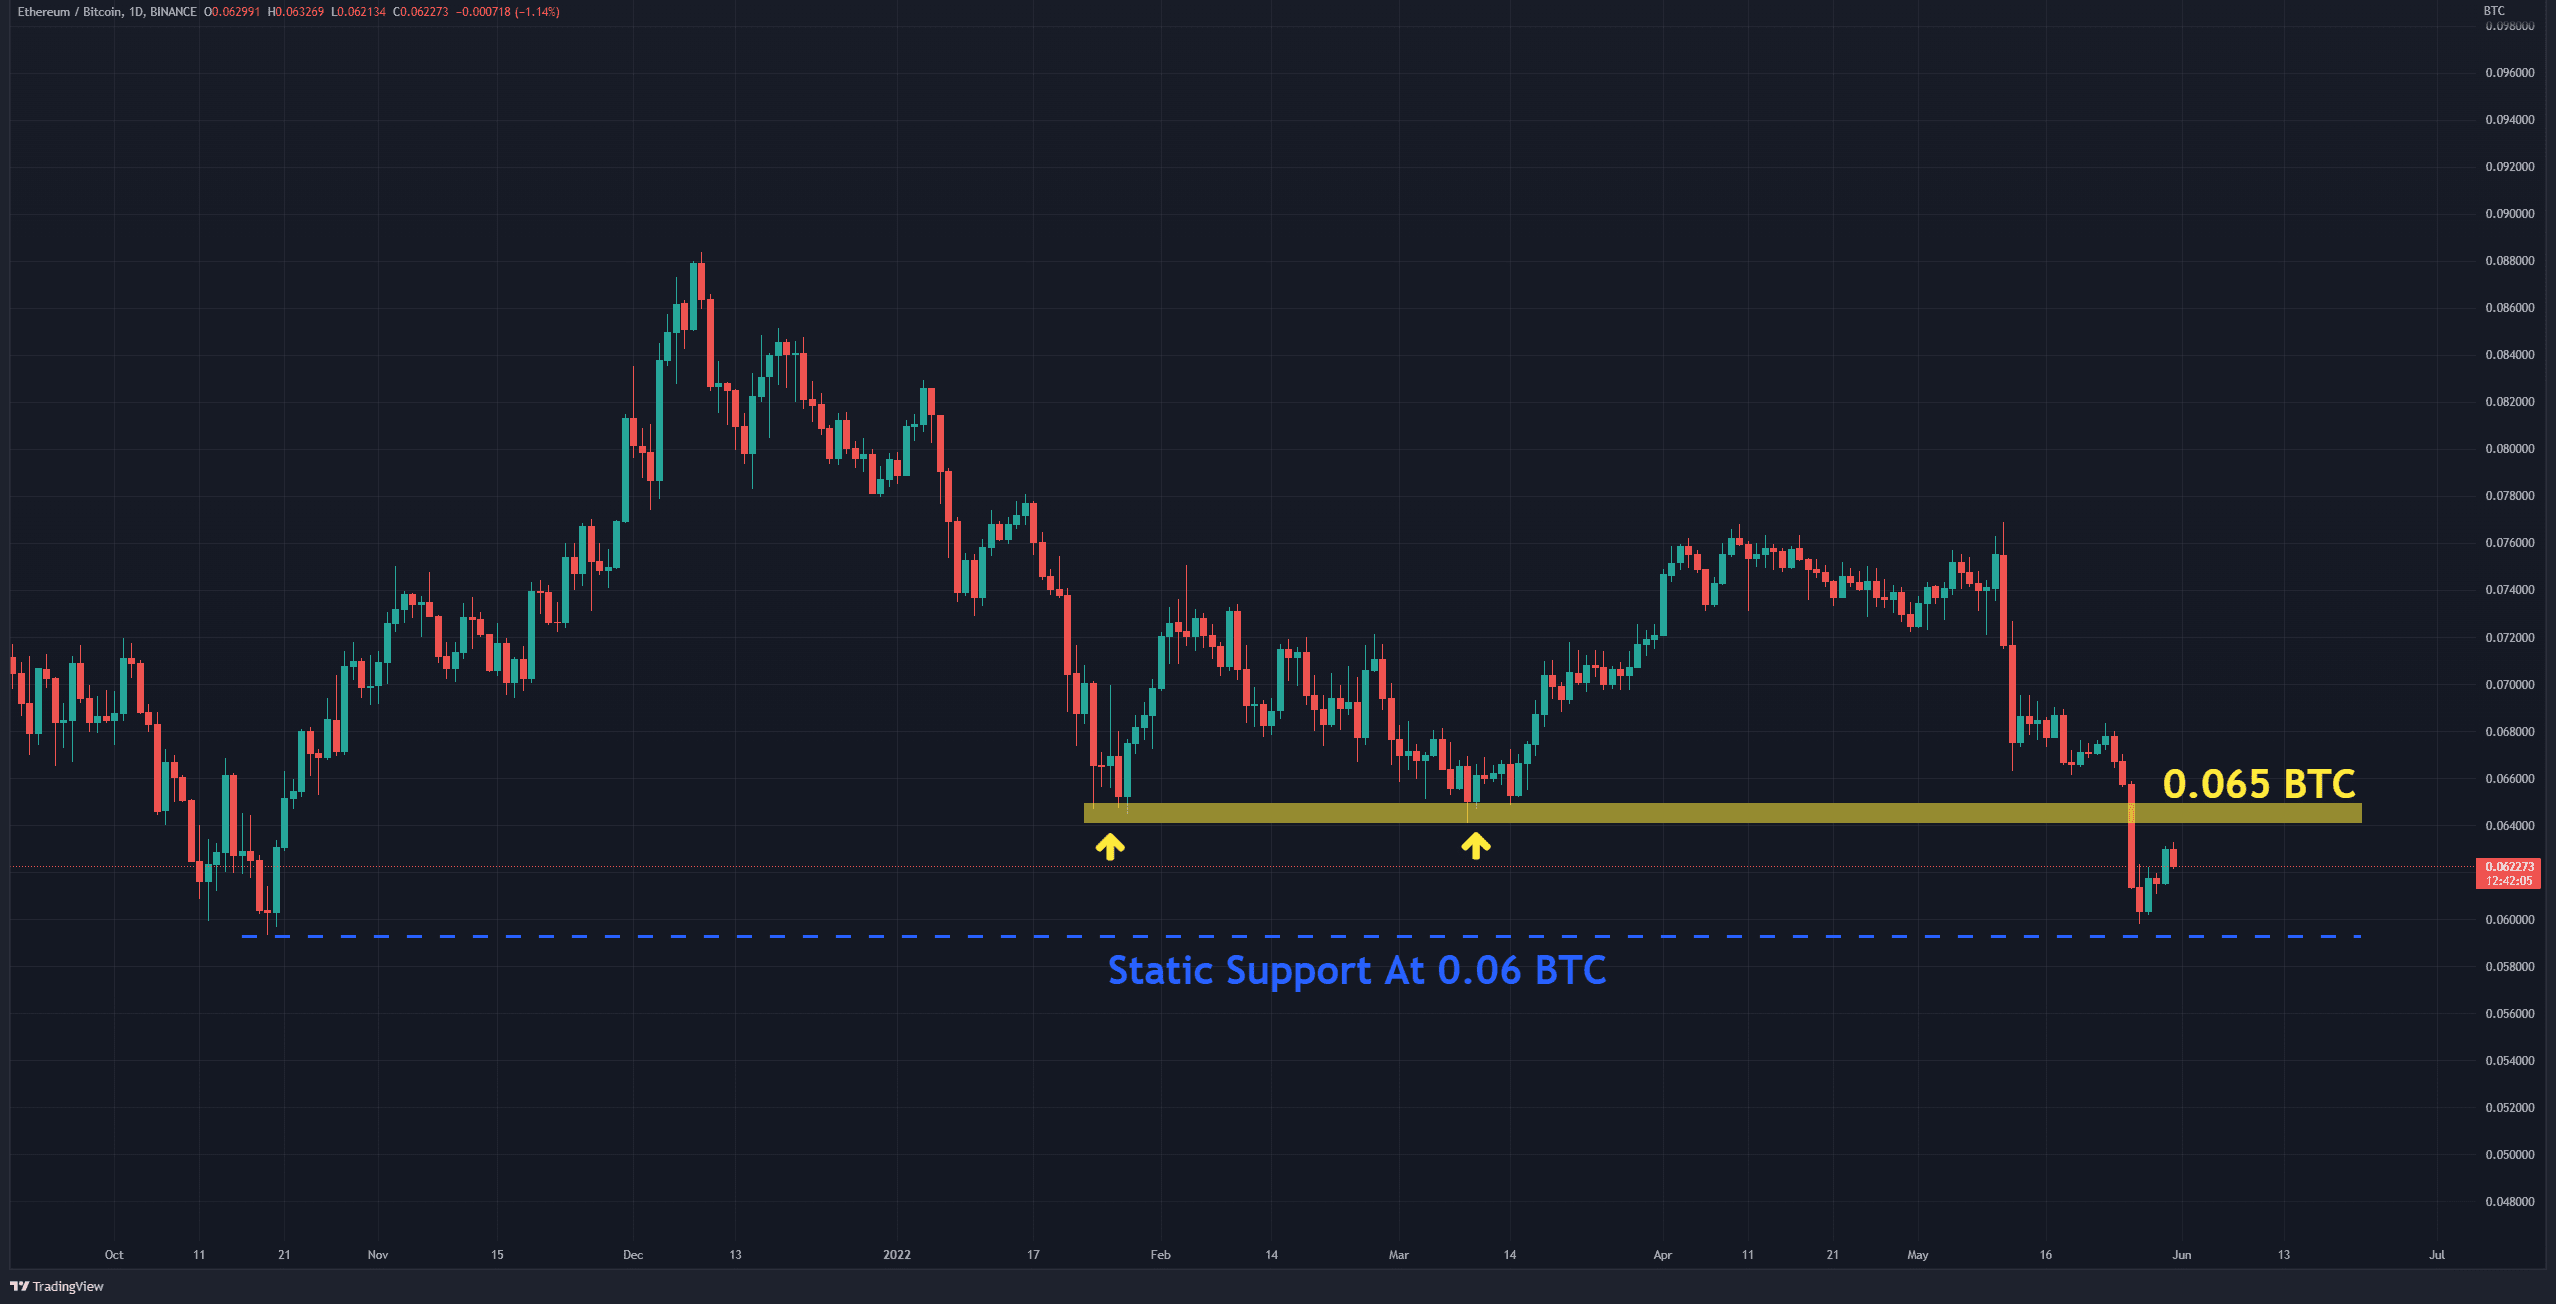
The bulls defended the horizontal support at 0.06 BTC (blue) throughout the current bearish phase. Prices reached a level not seen since last October. To outperform BTC, the buyers must first successfully overcome the horizontal resistance at 0.065 BTC (in yellow). All in all, the overall structure that is forming is significantly bearish. The possibility of lower levels will increase if the formation of lower lows and highs continues.
Key Support Levels: 0.060 BTC & 0.055 BTC
Key Resistance Levels: 0.065 BTC & 0.070 BTC
On-chain Analysis
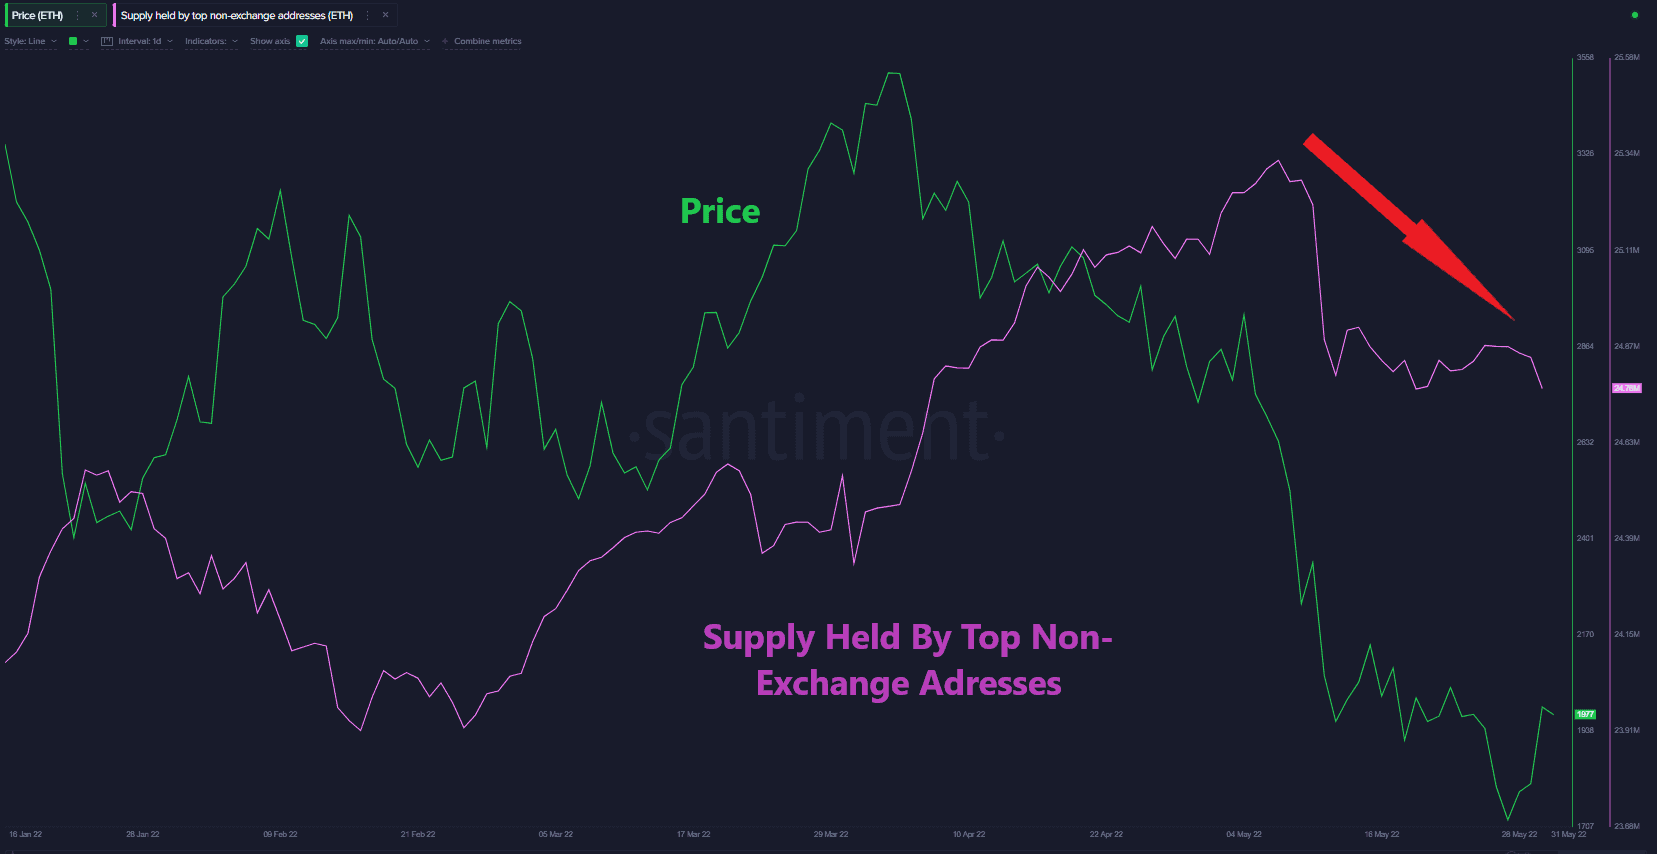
Supply Held By Top Non-Exchange Addresses
The amount of coins held by top non-exchange addresses continues to drop. Typically, as the price increases, this metric moves upward because the non-exchange addresses tend to withdraw their assets from the exchange and hold them. However, this metric has not experienced any growth despite the recent price spike. This can be interpreted as investors evaluating the market with doubt and fear.