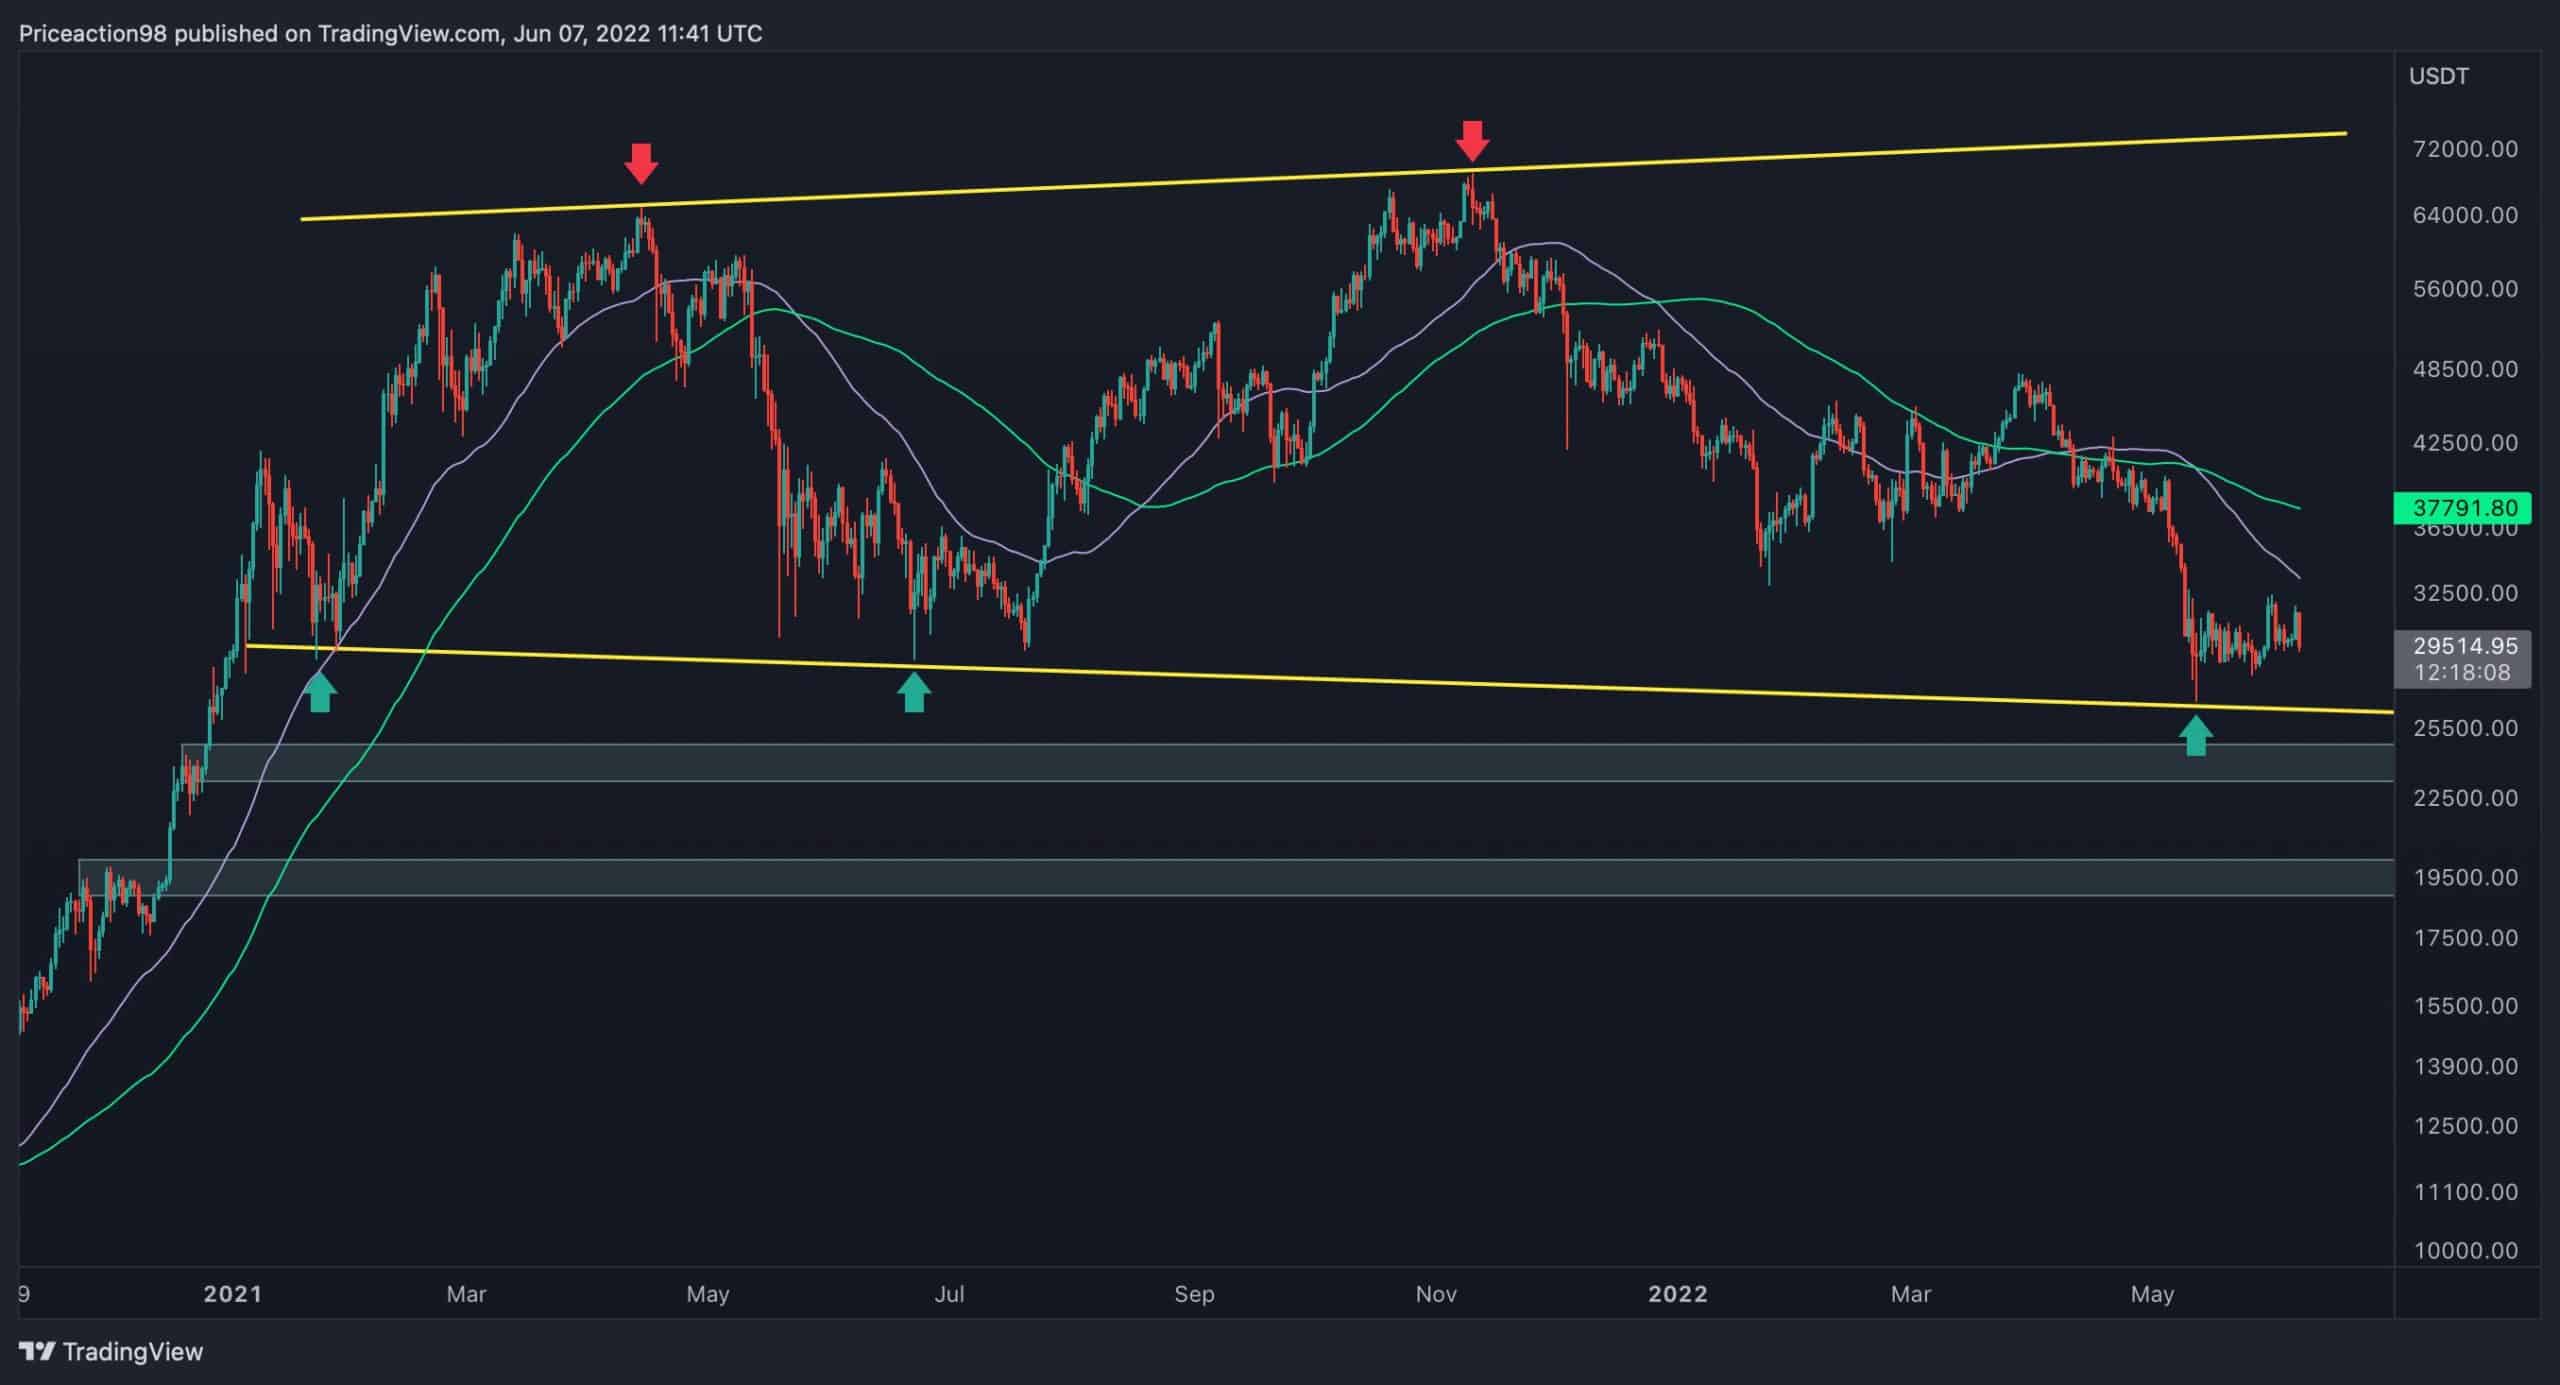
In the big picture, Bitcoin has been forming an expanding wedge pattern – a common technical pattern in forex markets. The price has touched the upper trendline twice at the $65K and $69K levels.
On the other hand, the crash of the LUNA-UST ecosystem seems to have played the role of a catalyst for the current bearish momentum, which saw Bitcoin’s price drop to $26K, touching the lower trendline for the third time.
Technical Analysis
By Shayan
The Daily Chart
The wedge’s lower trendline has been Bitcoin’s primary support level during the recent cycle and is expected to support the price as it did in May 2021. The 50-day moving average line and the $35K region will likely act as significant resistance levels if the market rebounds from the lower trendline.
However, if the trendline fails to hold the price, Bitcoin’s following levels of support will be at around $24K and $20K in-demand regions.
The 4-Hour Chart
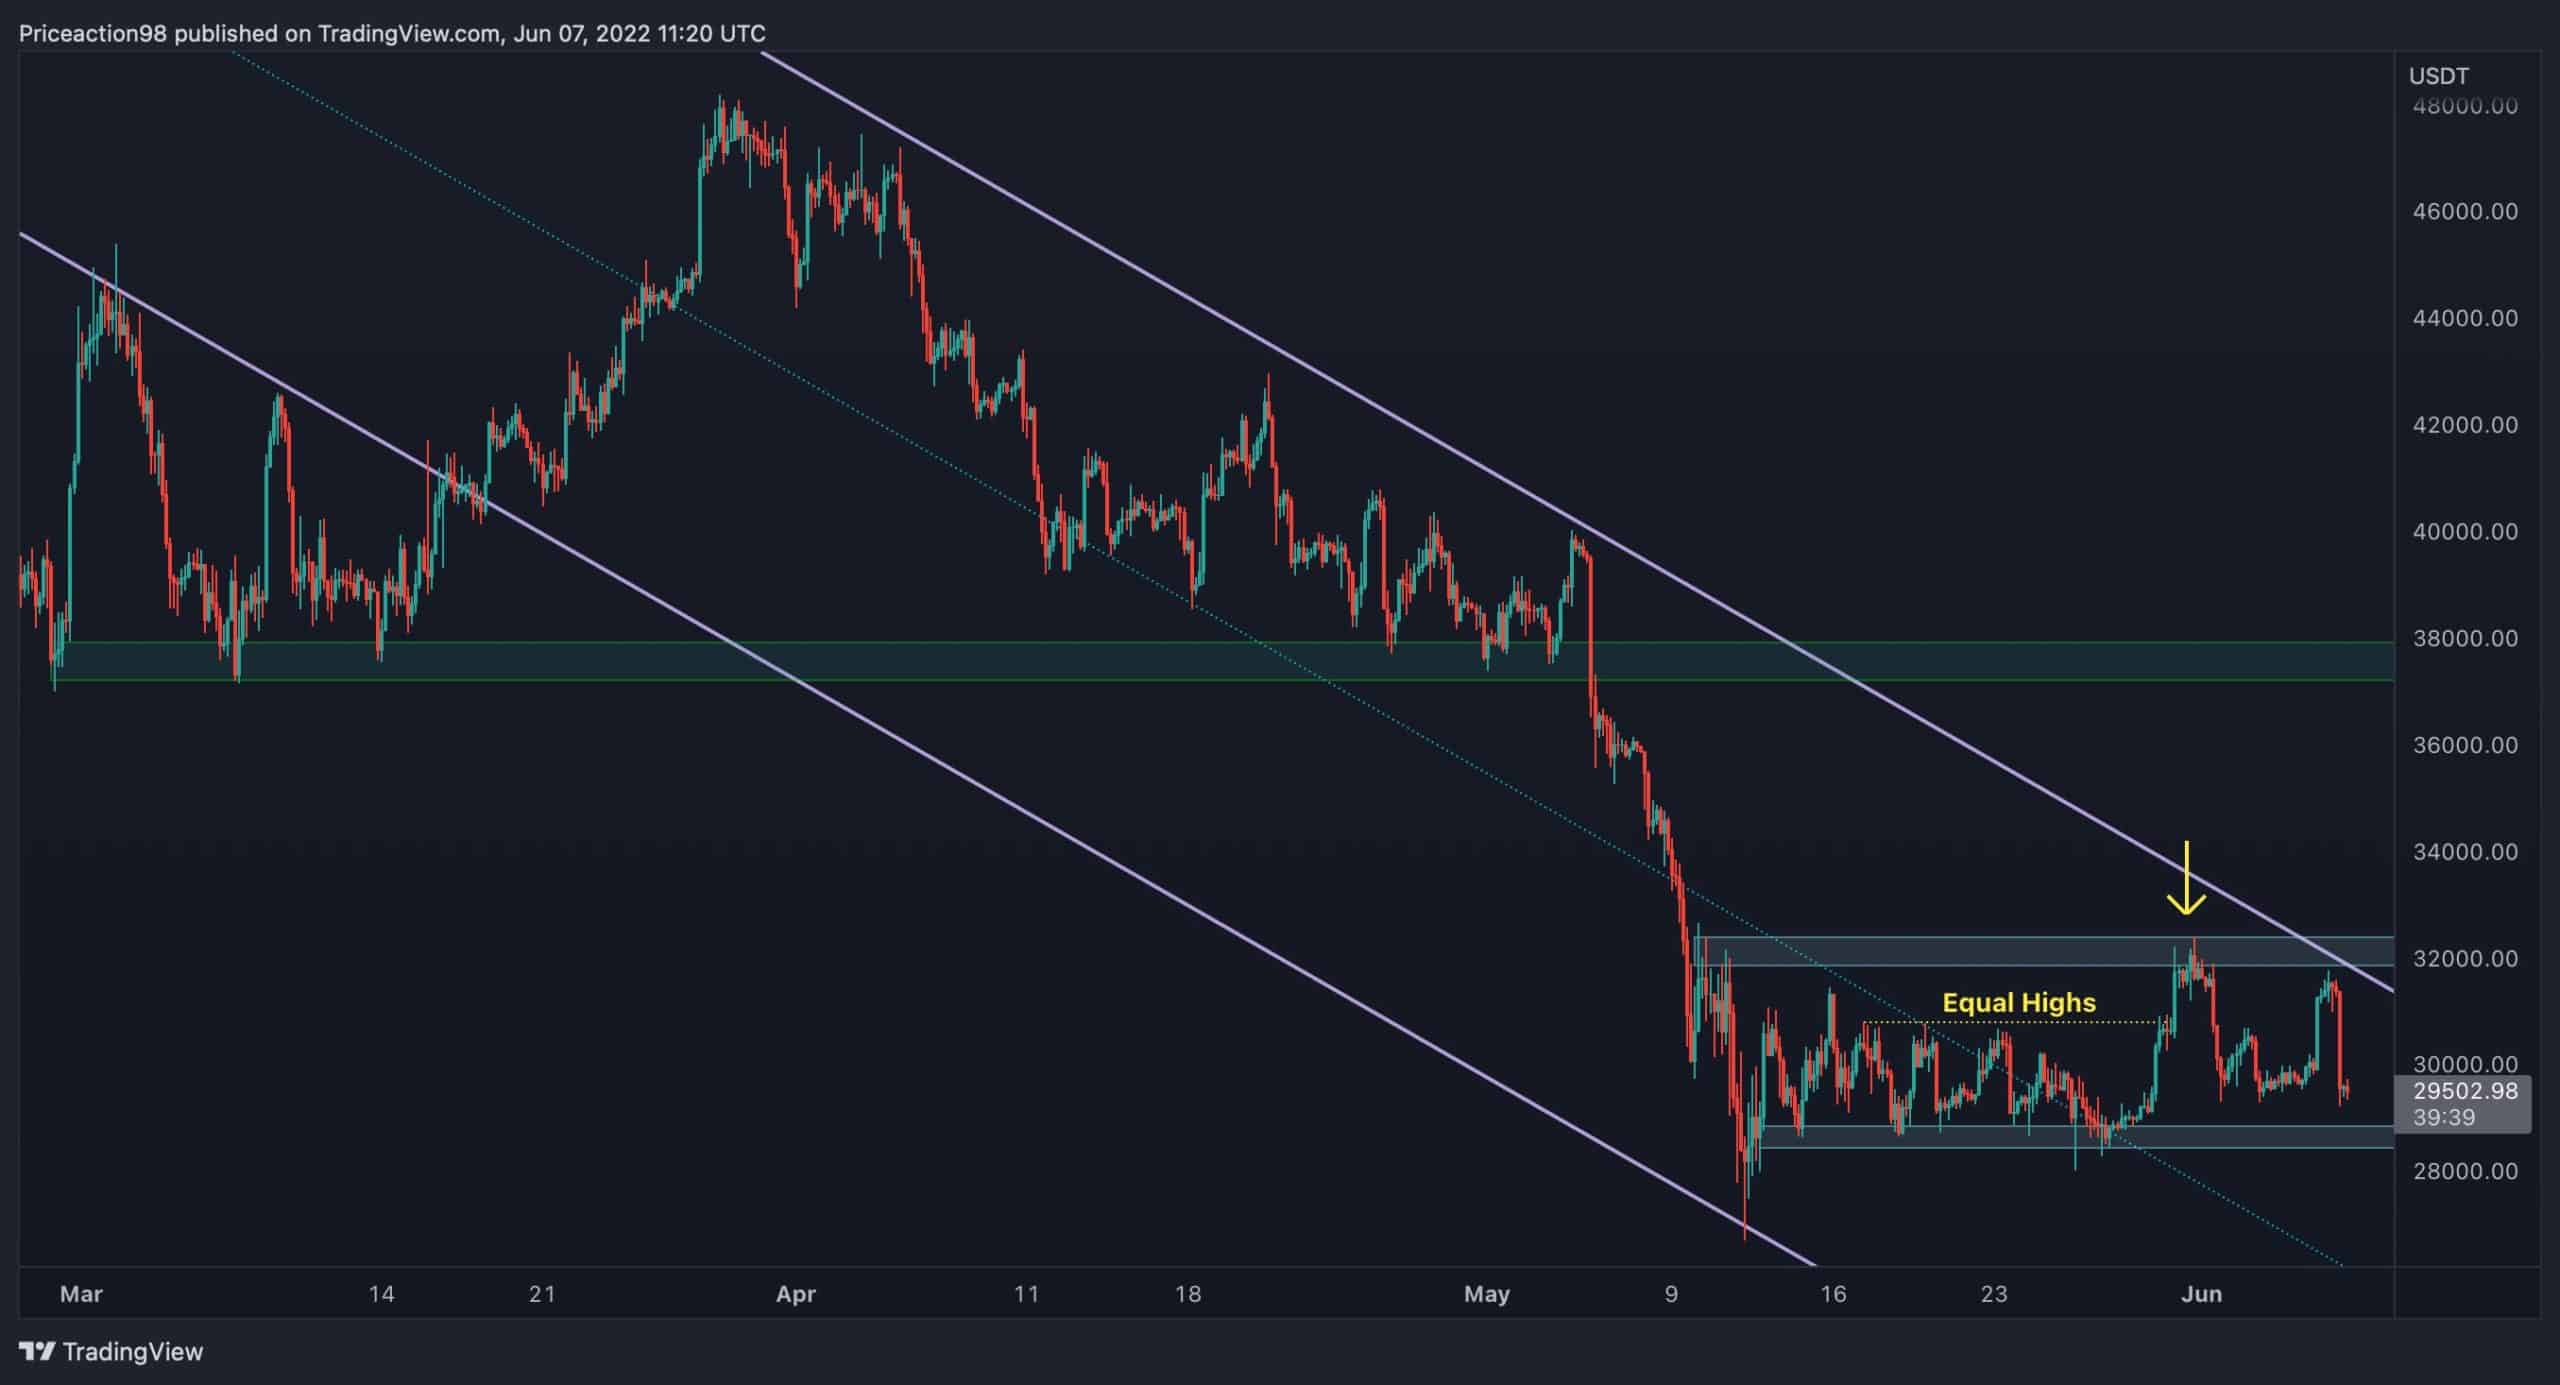
Bitcoin has entered a range phase forming equal highs. On the other hand, the cryptocurrency spiked and registered a higher high price action pattern (Yellow pointer), taking out all the resting liquidity above, which can be interpreted as a clear bull trap.
In the mid-term, BTC is expected to remain in this dull range, between the $29K and $32K, with substantial volatility due to futures market liquidations.
At the same time, the cryptocurrency has been moving inside a descending channel and has been rejected from the upper trendline. In the event of a breakout above the indicated range and the channel’s upper trendline, a bullish rally will be imminent. In that case, the $37K will be the significant resistance level.
Onchain Analysis
By Shayan
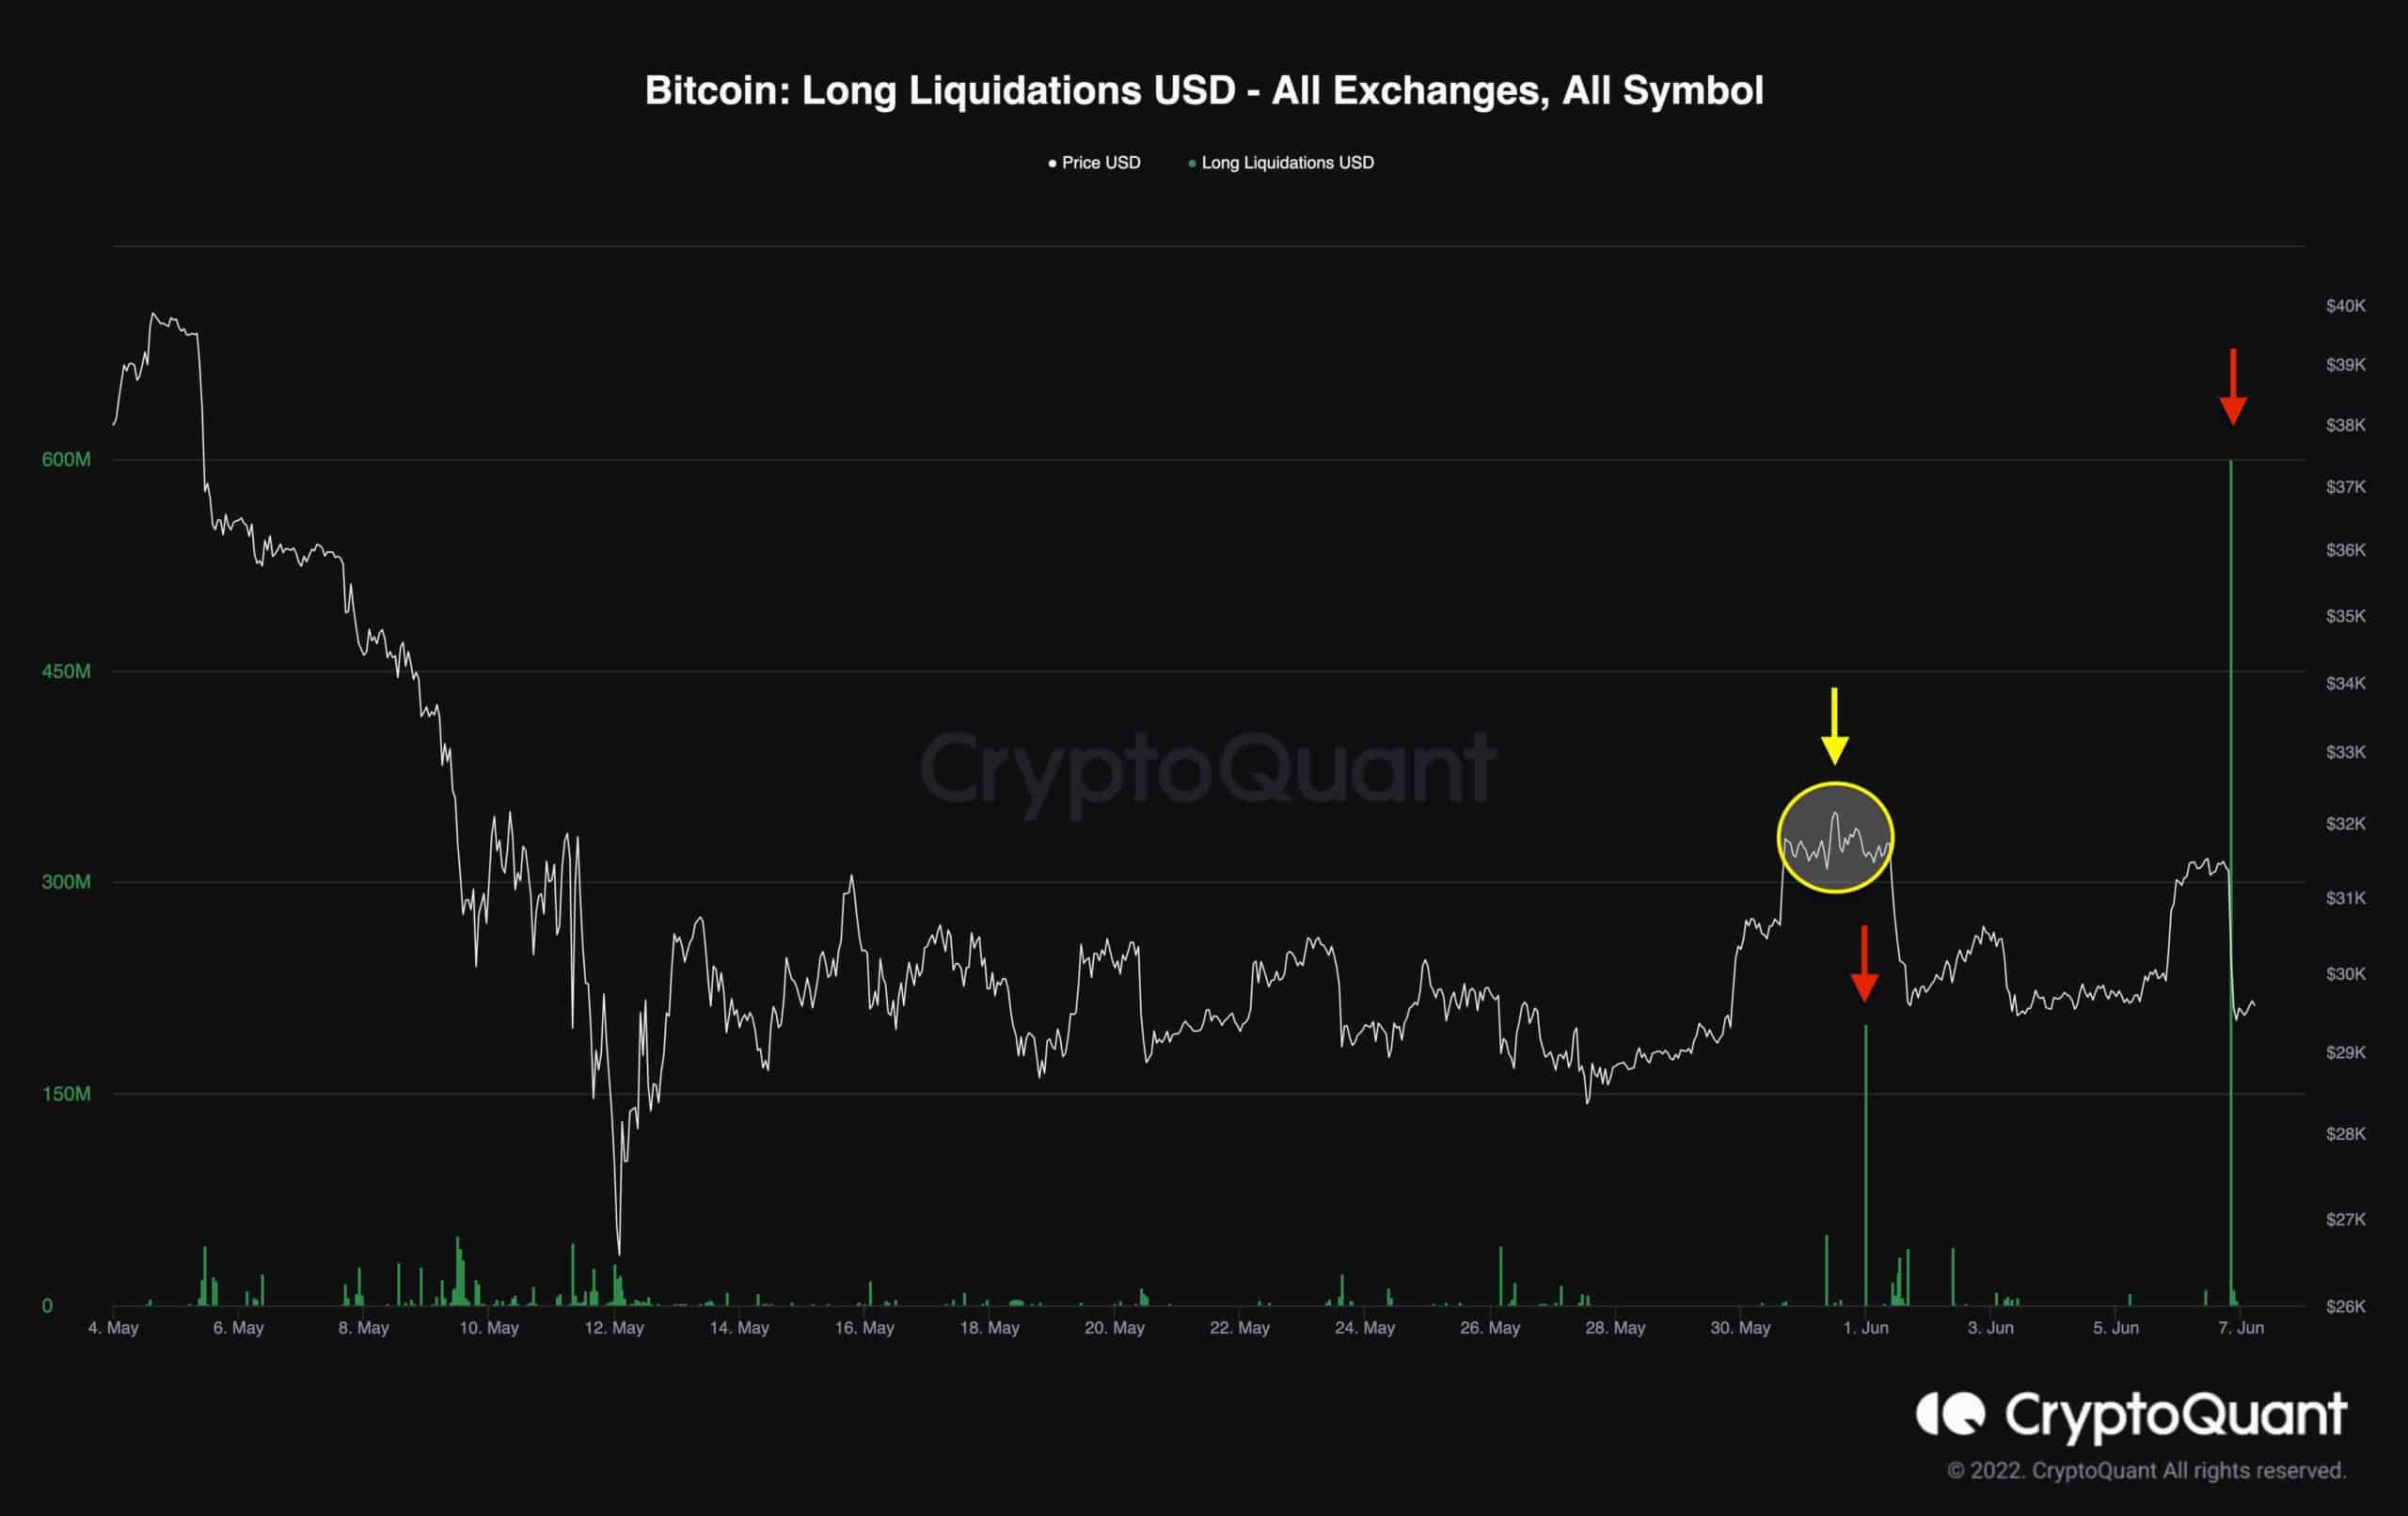
As shown in the chart, during consolidation phases, the market often takes out all of the retailers’ buy/sell stops in the futures market, resulting in massive liquidations in both directions.
Bitcoin established a high pattern (Yellow Pointer), a clear bull trap, followed by a market correction that liquidated many long positions. Furthermore, the same pattern is visible right now. The market has seen significant volatility in the last three days, resulting in a high amount of long liquidations.
When the market goes through extreme volatility and enters a consolidation period, these moves are inevitable. During these market stages, risk management is essential.