Over the last ten days, the $30K demand zone, which was expected to be a strong support level for reversing any downtrend price movement, was broken to the downside. Now, it acts as a magnetic resistance level in the market.
Technical Analysis
By Shayan
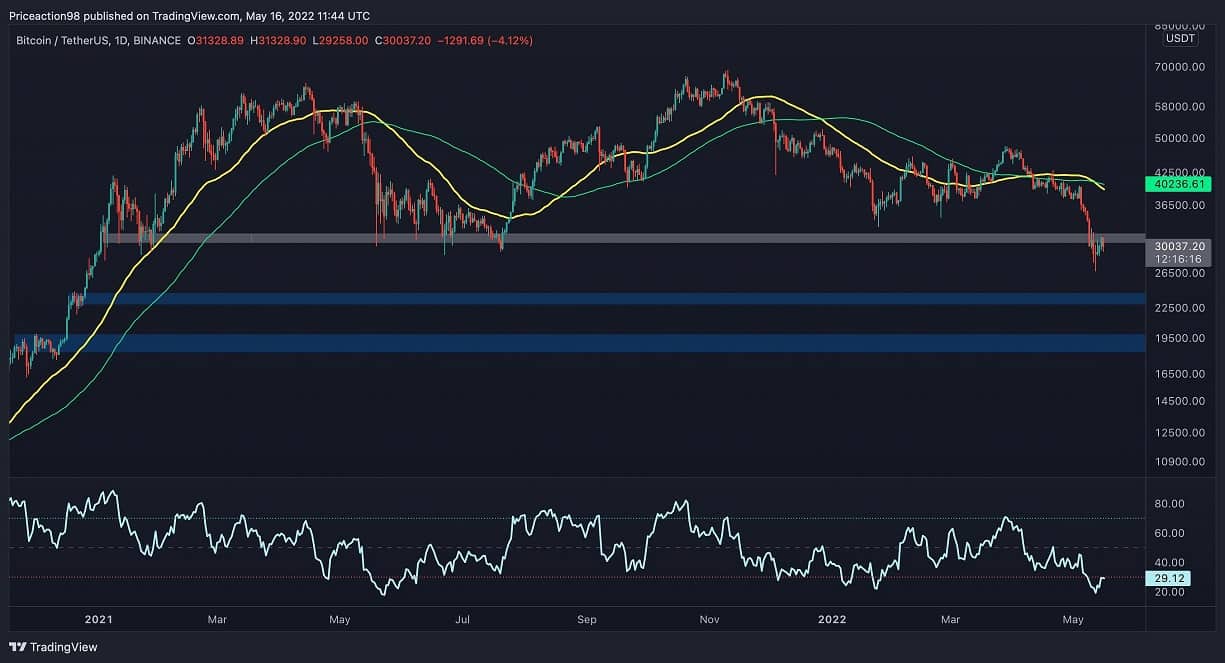
The Daily Chart
Bitcoin is now consolidating at around $29K, while the RSI indicator suggests the market is in an “oversold” state, with RSI levels of approximately 30%. Even though the RSI has reached the levels last seen during the May 2021 collapse, the 50-day and 100-day moving averages have completed a bearish crossover, which might increase the odds of lower prices in the coming days.
The following key levels of support for bitcoin are the $24K and the $20K substantial demand levels.
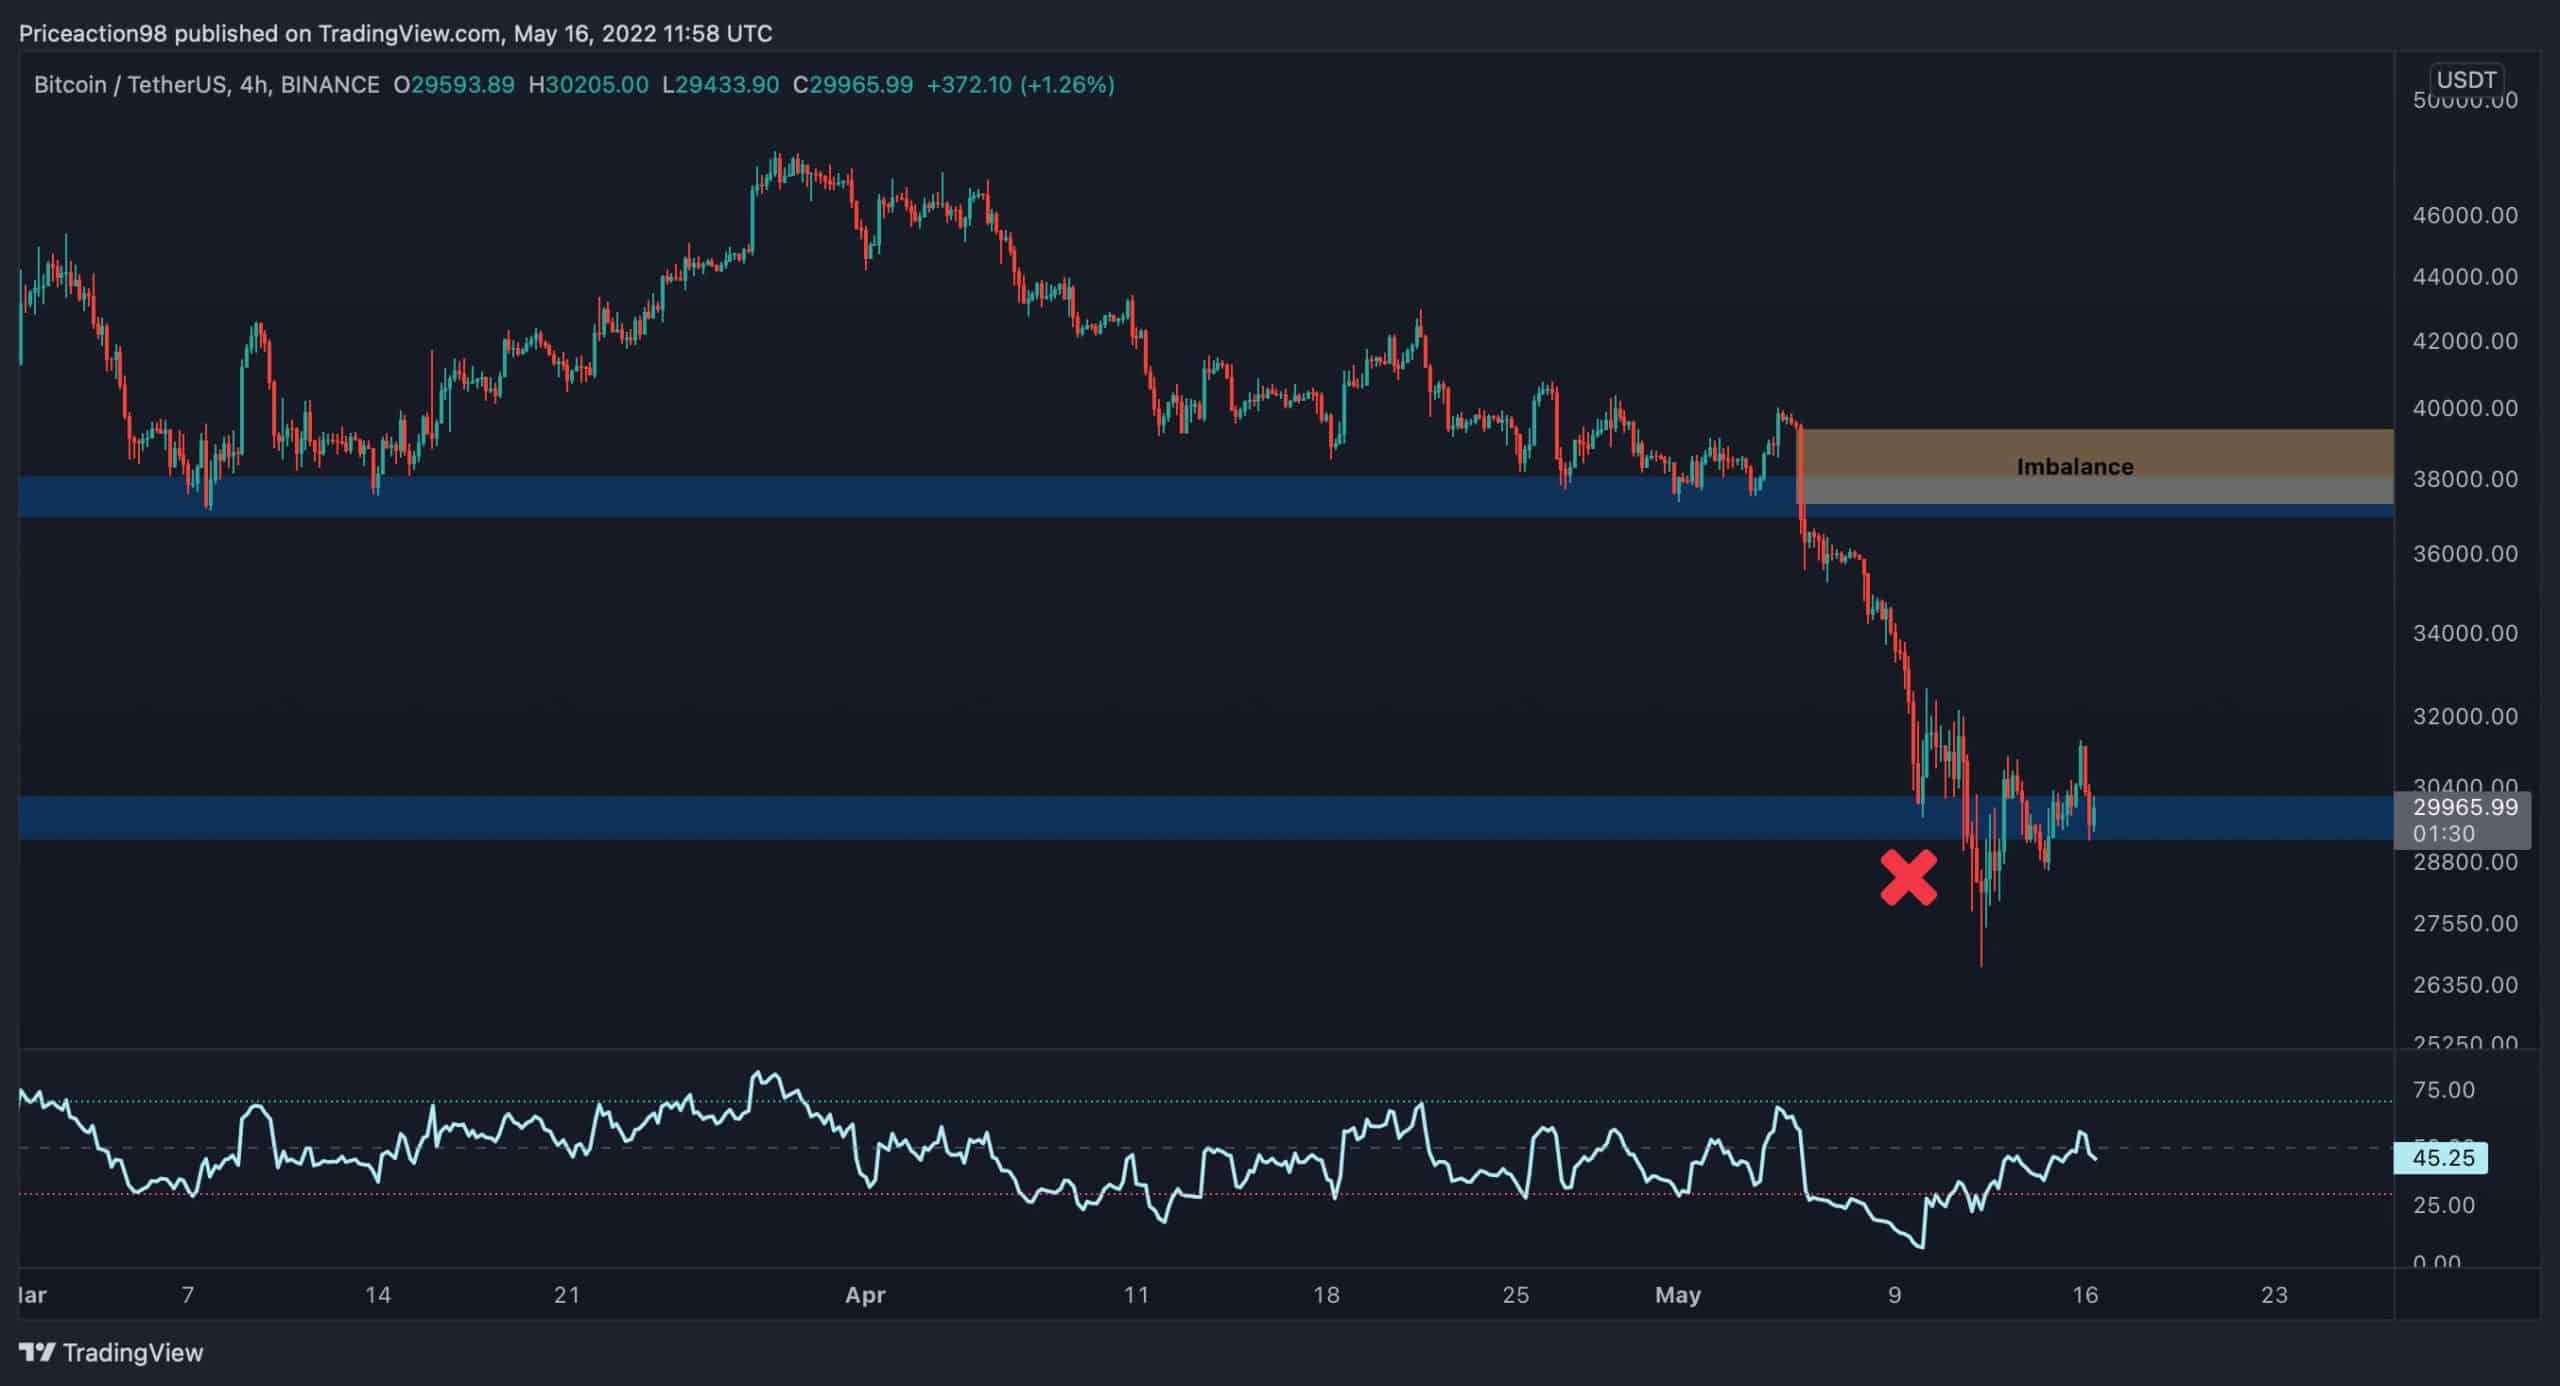
The 4-Hour Chart
On the lower timeframes, the $30K demand zone failed and was broken with significant bearish momentum. This indicates that the continuation of the bearish trendline is presently showing symptoms of exhaustion, and the market is expected to enter a mid-term consolidation phase.
However, there is a noticeable imbalance above the $37K critical resistance level, and the price will most likely attempt to fill the imbalance before beginning a subsequent bearish leg.
On-Chain Analysis
By Edris
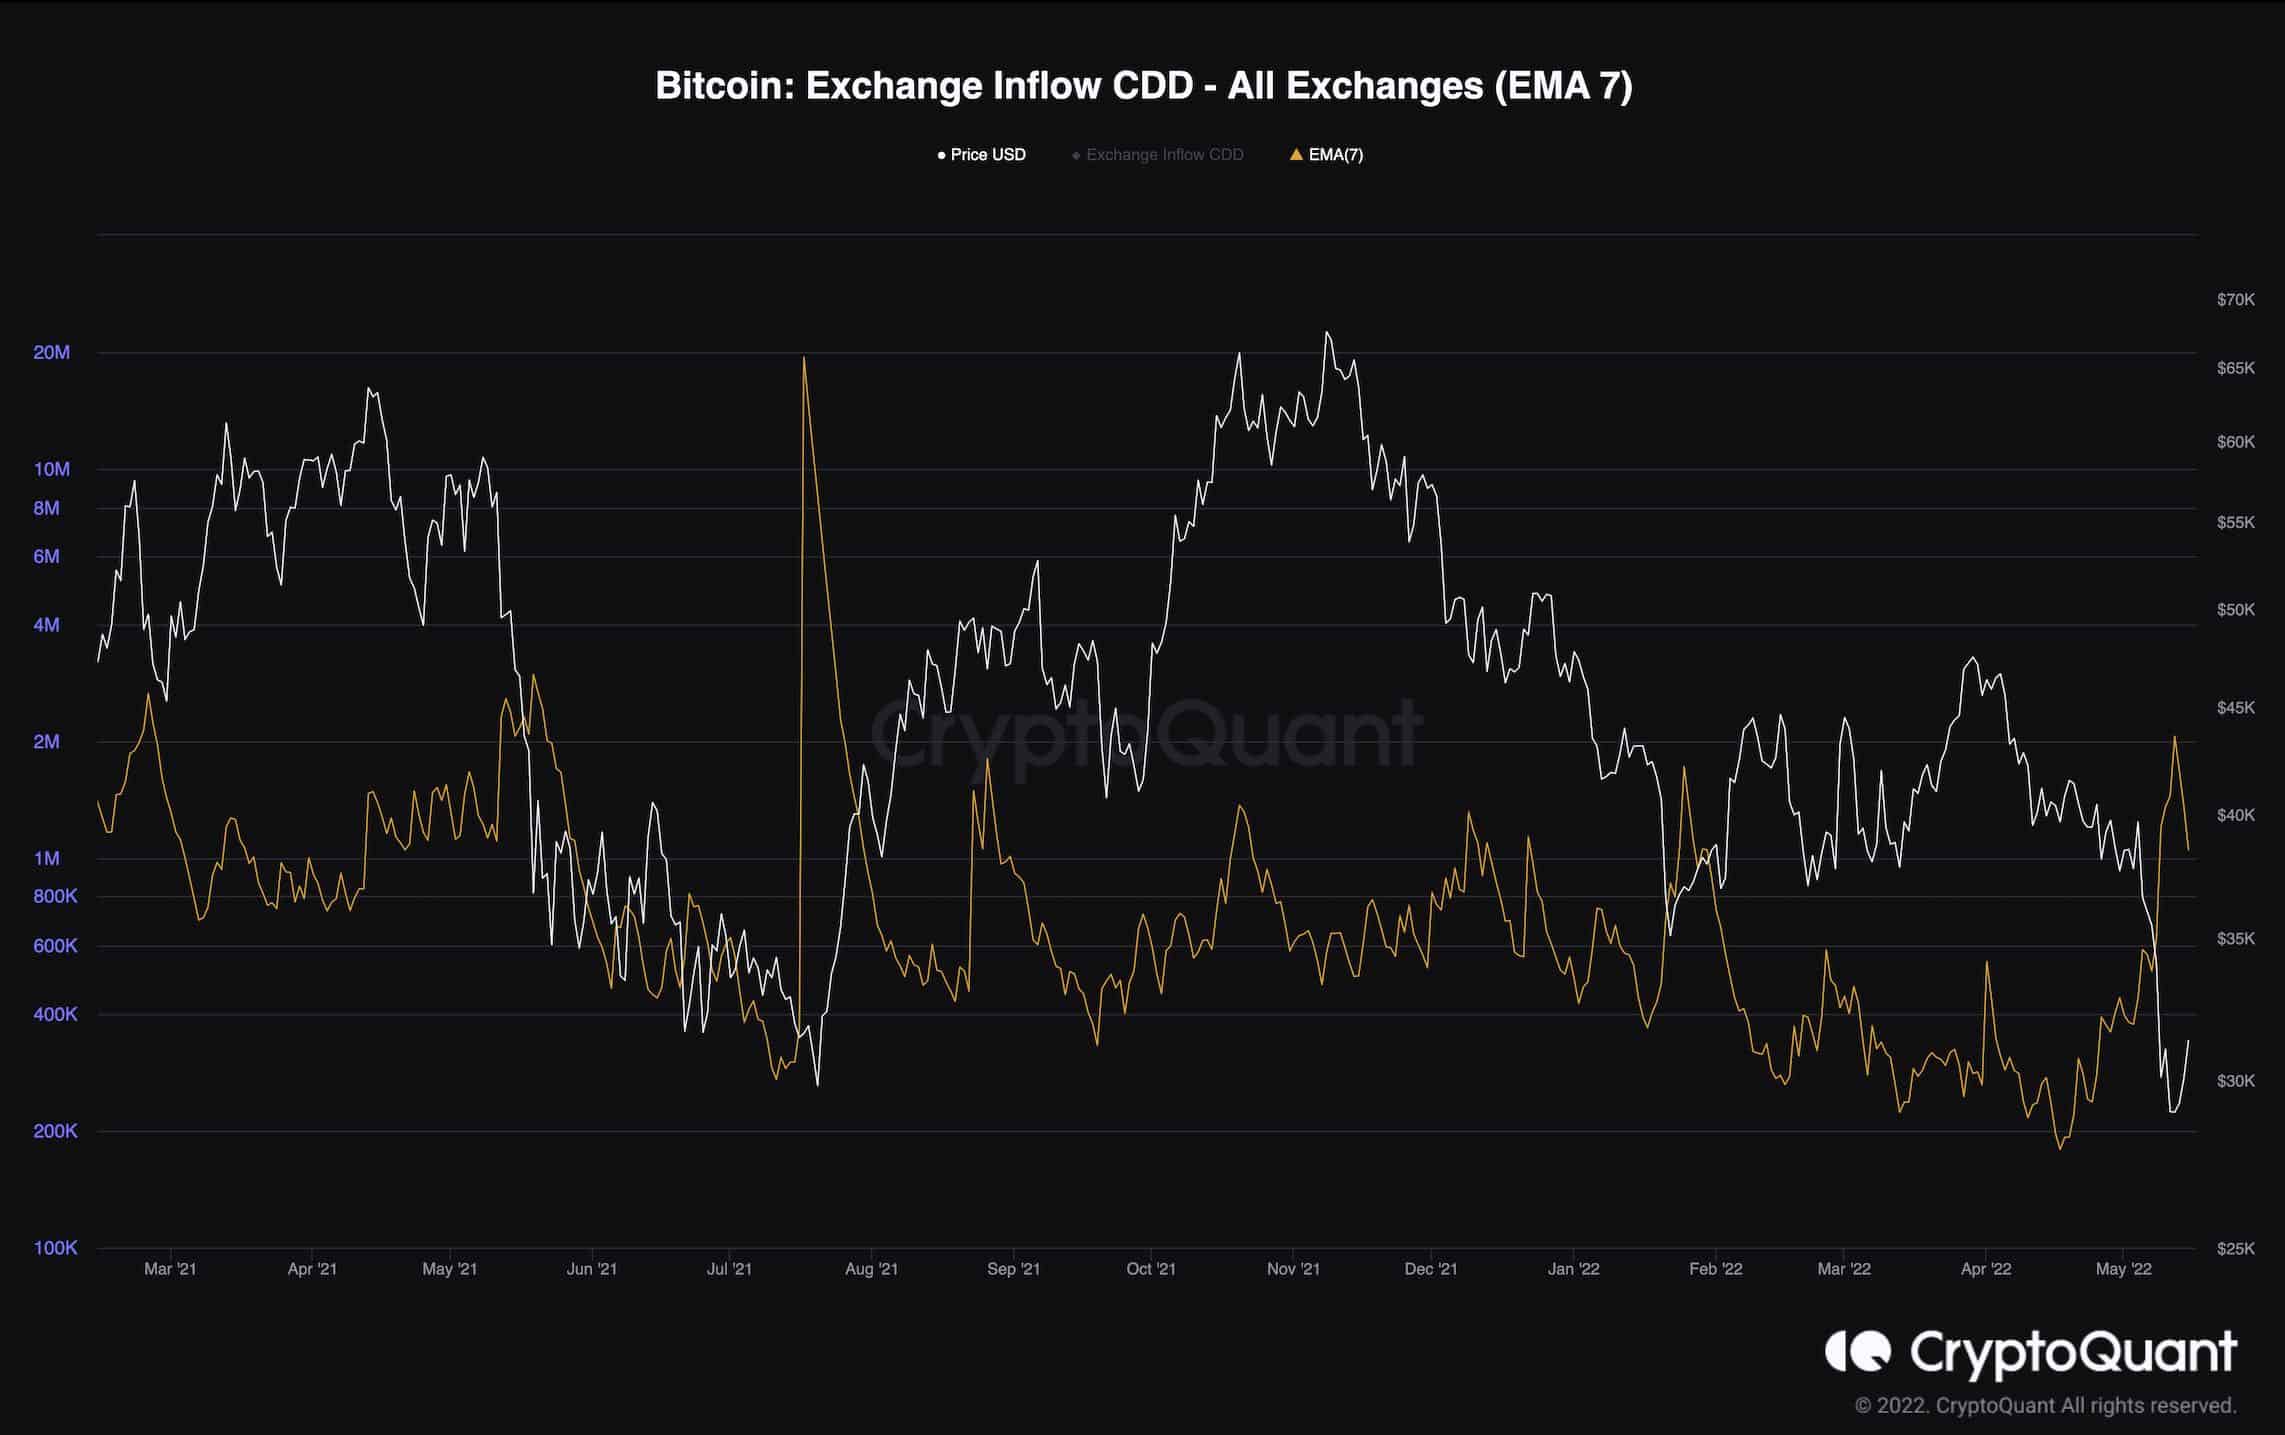
Bitcoin Exchange Inflow CDD
Bitcoin’s price has been declining rapidly over the past couple of weeks. It has even broken below the 2021 $28K bottom, dropping to the $26K-$27K area, before rebounding and retesting the $30K zone, which is now acting as resistance.
This massive crash has caused extreme fear and uncertainty, leading to a lot of panic-selling by the short-term holders. However, it seems like the long-term holders are also going through a capitulation phase. This chart demonstrates the Exchange Inflow CDD metric (7-day moving average).
The Exchange Inflow CDD is a metric that determines whether the coins flowing into the exchanges have been held for a short or long term, as it rises when older and dormant coins are being moved to exchange wallets.
This metric has been increasing rapidly over the past few weeks, indicating massive inflows to the exchanges by long-term holders. This could be interpreted as a long-term holders’ capitulation phase, as they are depositing their coins into the exchanges to sell. These capitulations tend to occur when a bottom is close – near the end of bear markets. However, the price could still go through a frustrating consolidation, and it could take a while before a new bullish trend could be expected.