Bitcoin is still consolidating around the $30K level, as the bulls and bears are fighting to establish control over this area and decide the next direction.
Technical Analysis
By: Edris
The Daily Chart
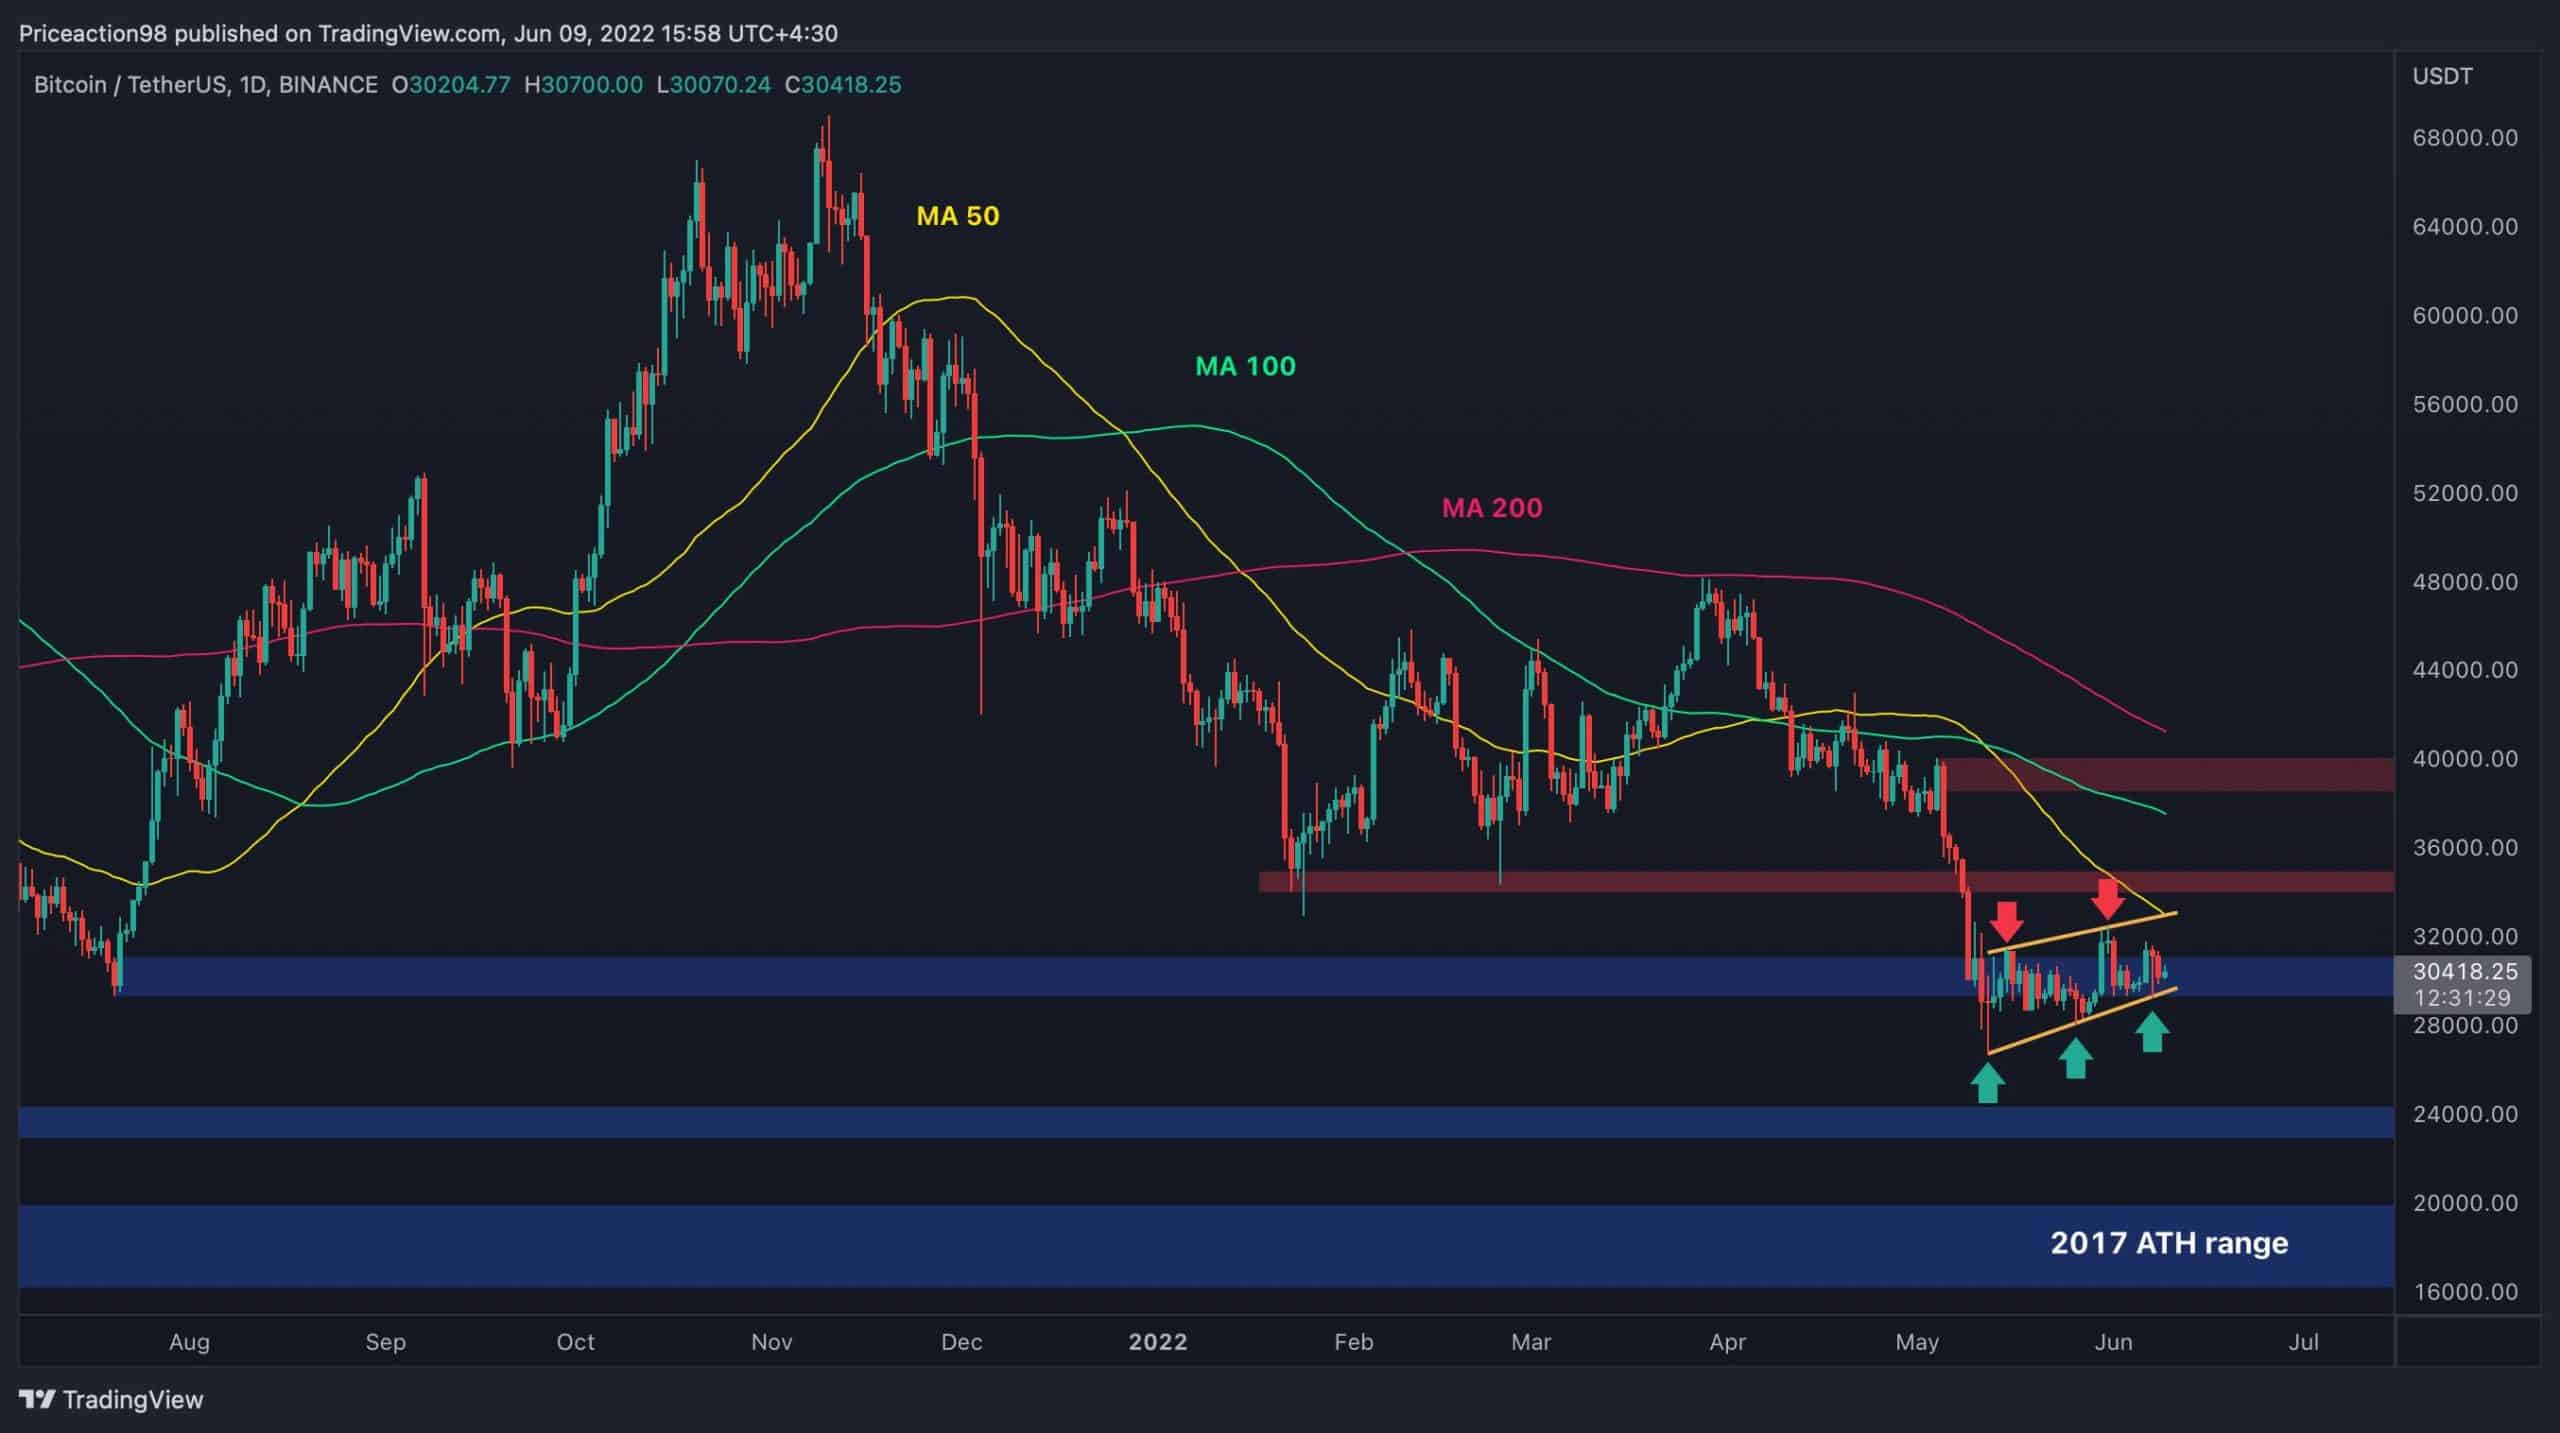
The price has been forming a relatively tight bearish flag pattern on the daily timeframe after dropping impulsively below $40K. This is a continuation pattern, and in case the price breaks below it, a further bearish leg towards the $24K demand zone and even the $20K range (2017 all-time high range) would be probable.
On the other hand, a failure and breakout to the upside from the flag would be considered a bullish signal. Nevertheless, the price would still need to break above the $32K level, the higher trendline of the pattern and the 50-day moving average, before a bullish reversal could be expected.
The 4-Hour Chart
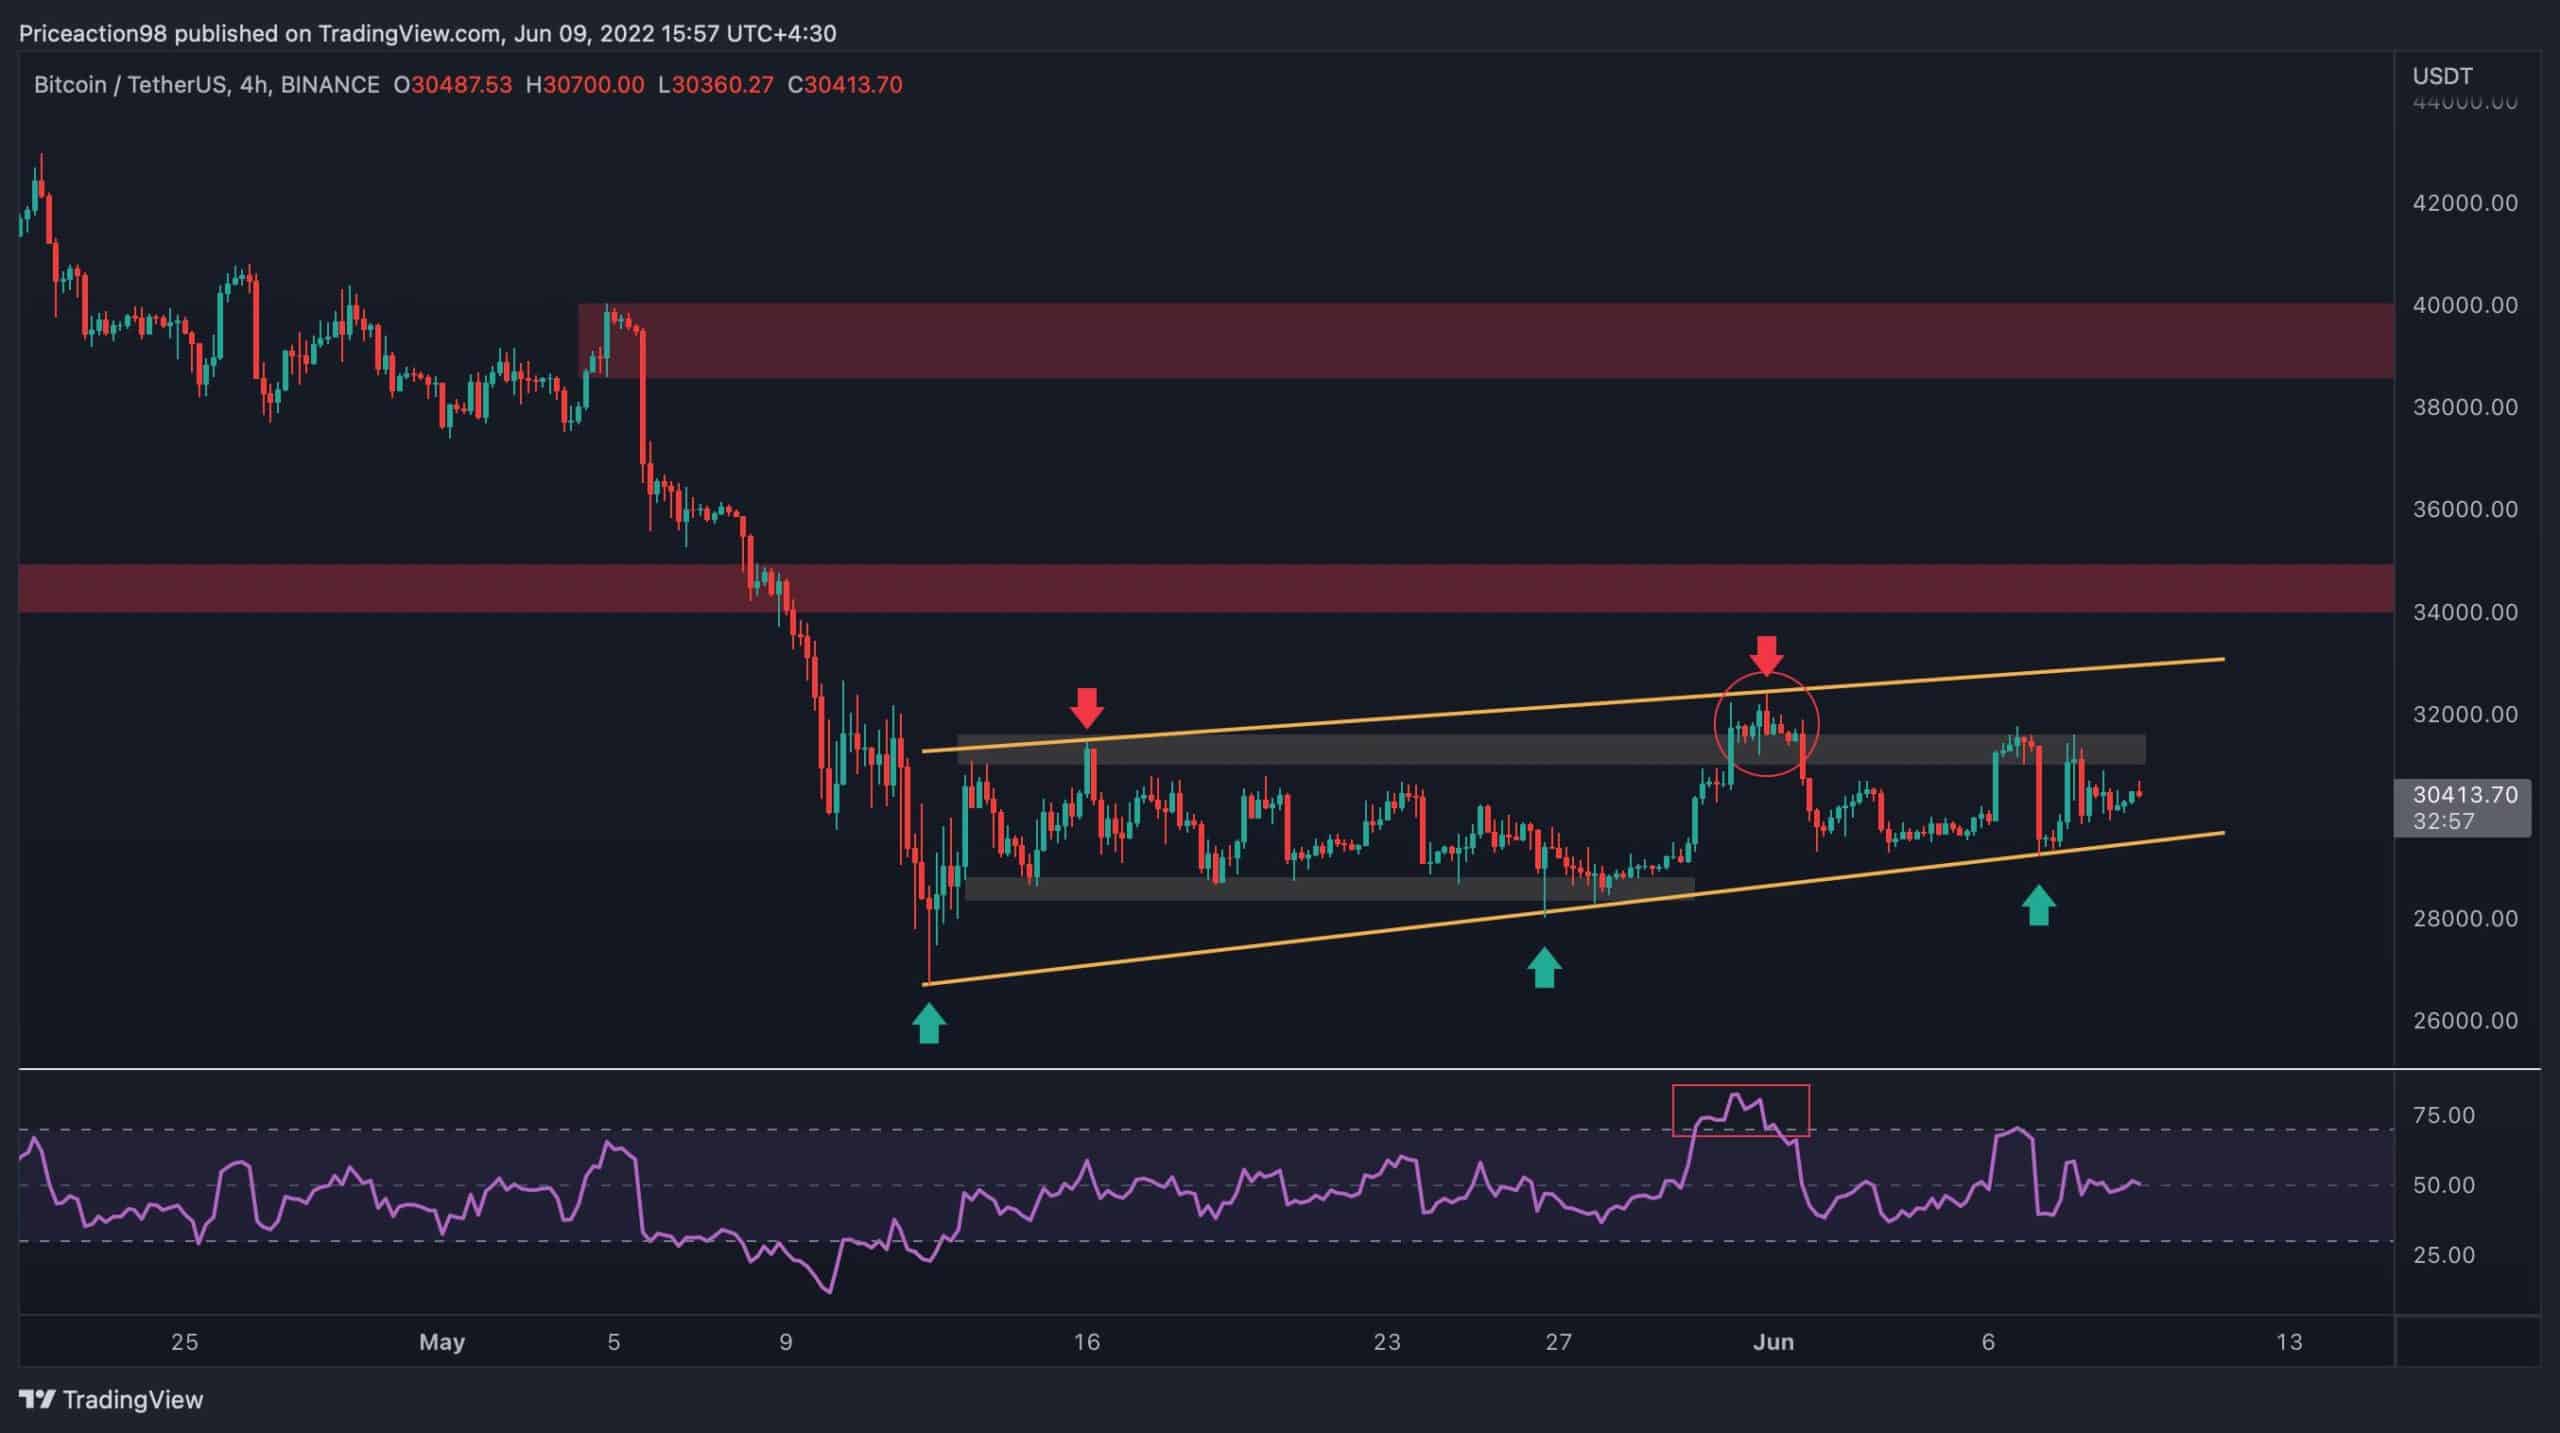
The abovementioned bearish flag pattern is seen more clearly in the 4-hour timeframe. It’s currently being validated by two top and three bottom touches.
The price has been testing the $31K resistance level multiple times over the last few weeks and failed to break above it, aside from the fake bullish breakout in late May. However, a push above this level would be probable as considerable liquidity would be resting above it.
If that’s the case, the price could test the top boundary of the flag for the third time before a bearish breakout and continuation lower towards the $24K demand zone. The RSI also oscillates around the 50% mark, indicating that the momentum is in a proximate state of equilibrium, and neither the bulls nor the bears are dominant in this timeframe. The potential third touch of the top could also form a bearish divergence with the RSI, a signal which would further validate the bearish continuation scenario.
On-Chain Analysis
By: Edris
Bitcoin MVRV Ratio
History may not repeat itself, but it rhymes. Most analytical methods in the financial markets are based on the past, as analysts rely on re-occurring patterns in price and technical and fundamental indicators to predict the future value of a specific asset.
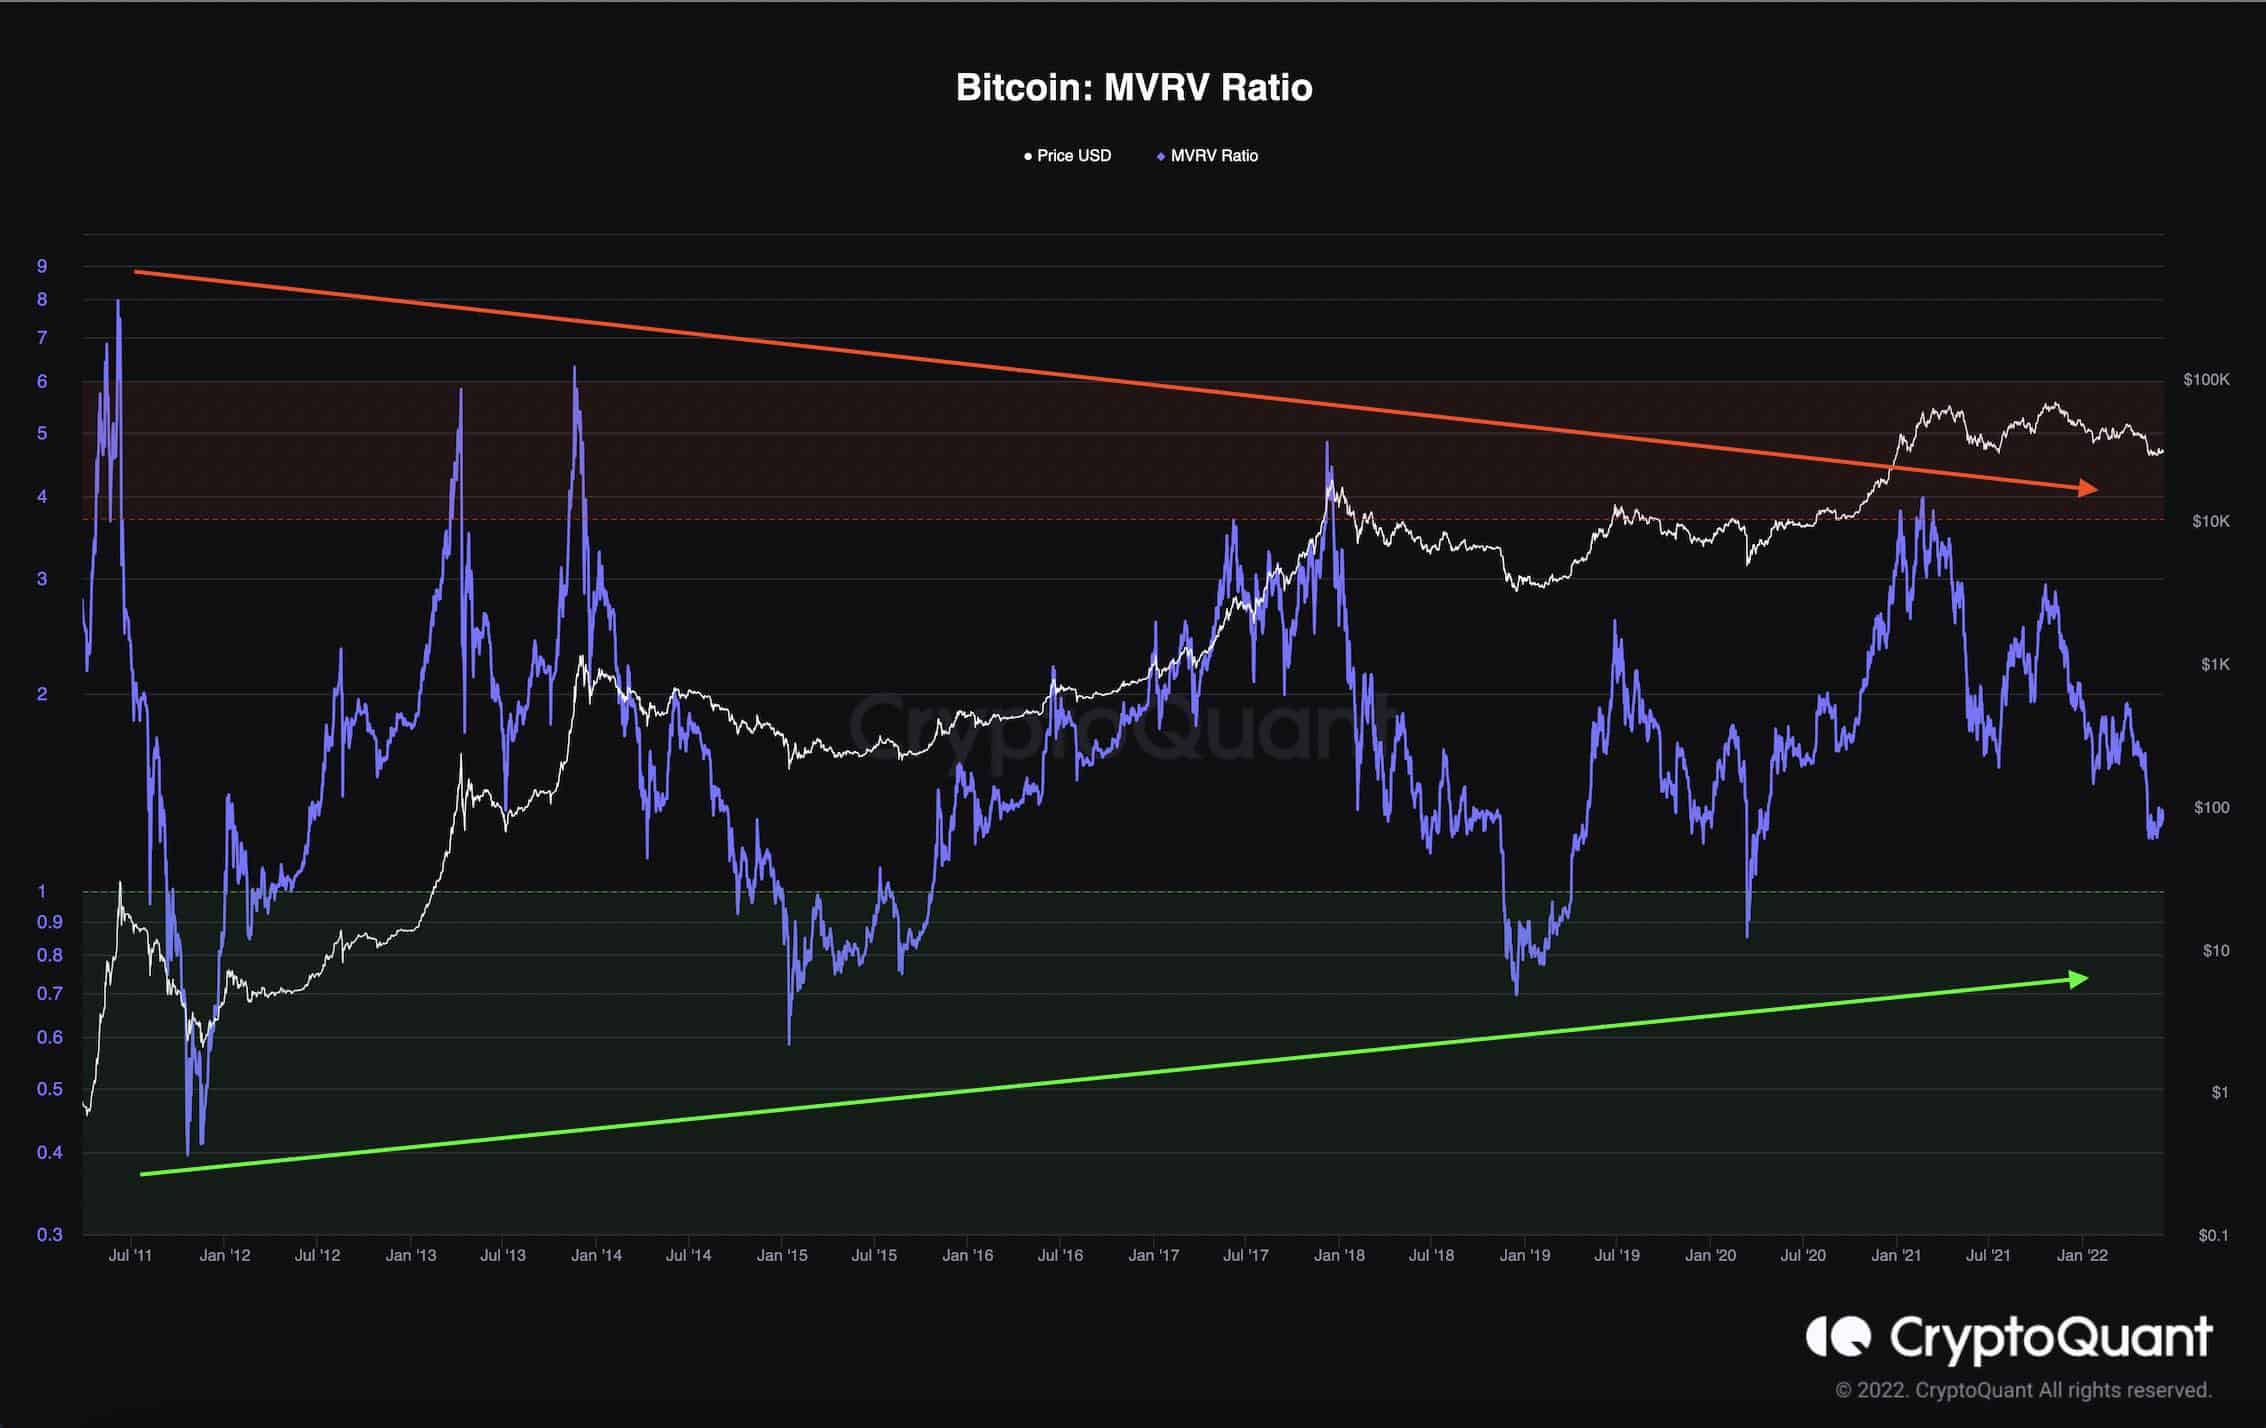
One of the most valuable indicators in determining whether Bitcoin is over or undervalued is the MVRV ratio which is calculated by dividing the Bitcoin market cap by the realized cap. Values below 1 indicate that Bitcoin is undervalued, and values above three are often associated with highly overvalued prices.
So, the MVRV metric can be used to estimate bull market tops and bear market bottoms. It is evident on the chart that previous bear market bottoms have occurred while the MVRV ratio had values below one. These often-lengthy periods are when the smart money tends to accumulate BTC, creating sufficient demand to form price bottoms.
The MVRV ratio currently sits around 1.3, indicating that the price could still experience more decline before a cyclical bottom forms.
Another interesting point is the diminishing returns and losses over the last 12 years. It has to do with Bitcoin’s decreasing volatility on the road to becoming the “digital gold” as it tries to transition from a highly volatile risk asset into a more stable, disinflationary haven.