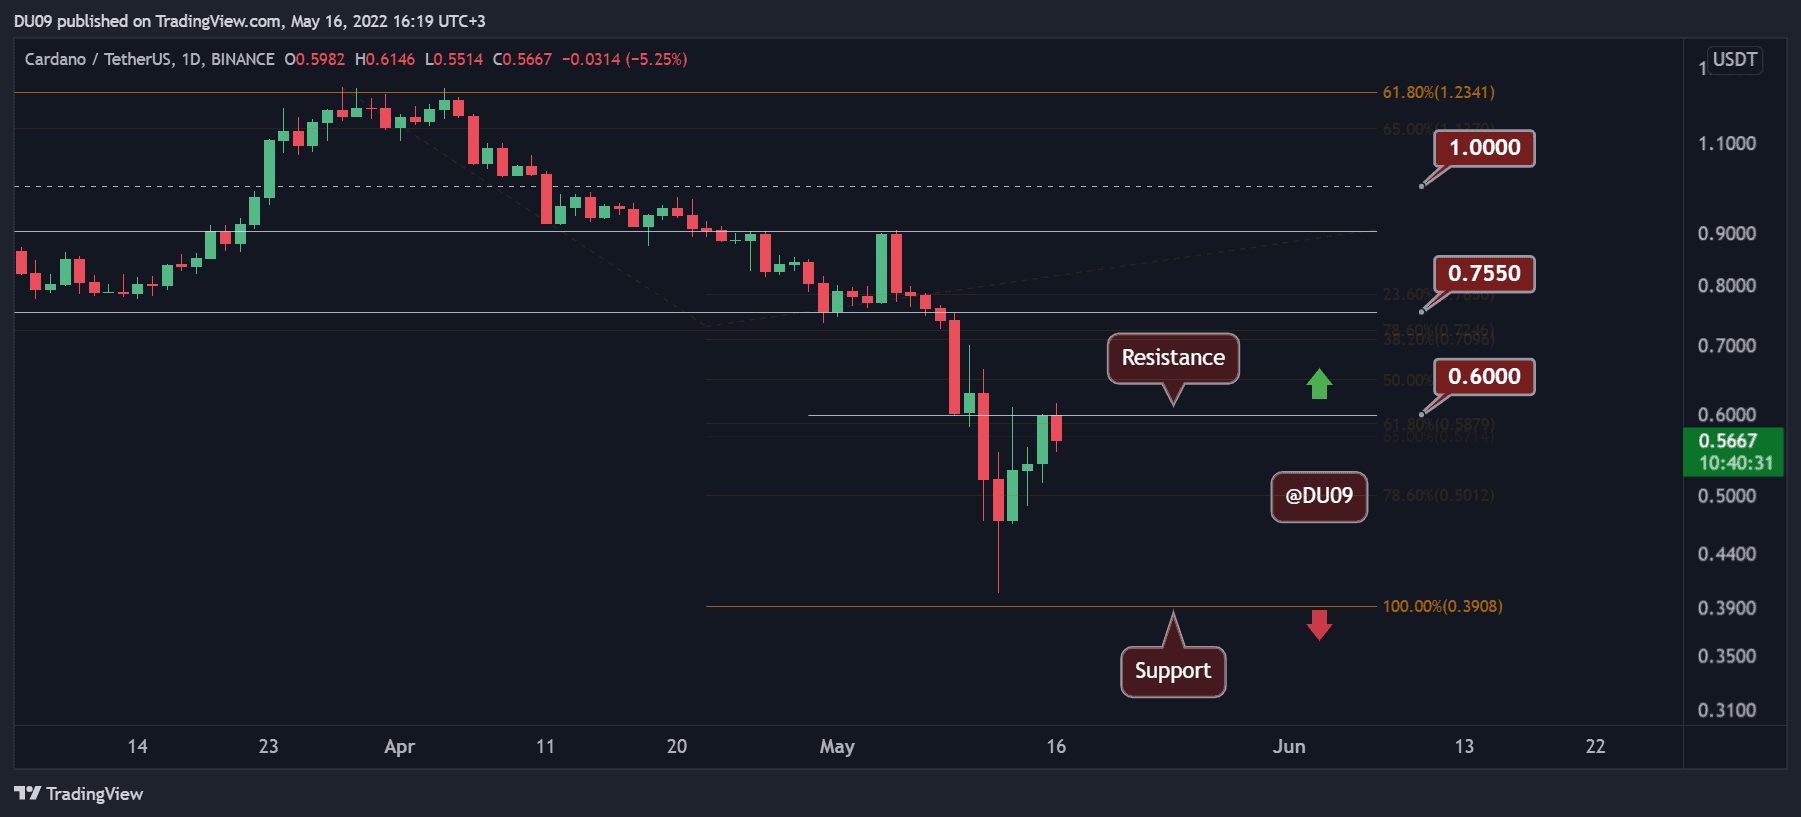
ADA has rallied over 50% since the crash on May 12th, with the price now sitting under a key resistance.
Key Support levels: $0.40
Key Resistance levels: $0.60, $0.75
In the past few days, ADA entered a relief rally, moving very fast from the key support at $0.40 towards the resistance at $0.60. Buyers have to maintain this momentum if they wish to push prices above $0.60 and towards the next important level at $0.75.
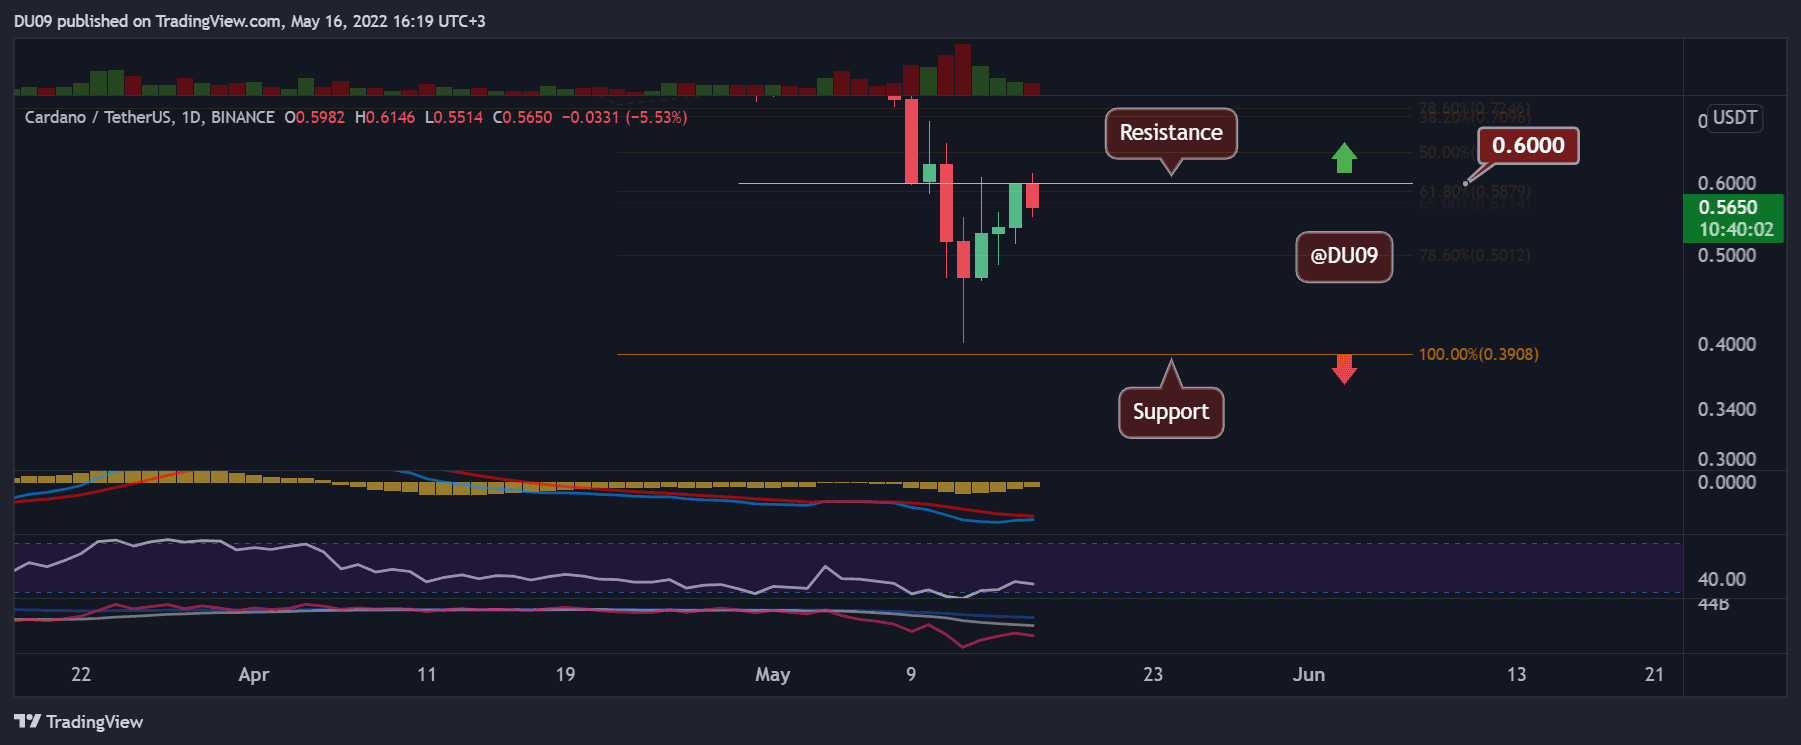
Technical Indicators
Trading Volume: The volume spiked on May 12th but then quickly faded. Nevertheless, the price managed to pull a significant recovery.
RSI: The daily RSI fell under 30 points but has now recovered and is currently trying to make a higher low. If successful, ADA could prepare the stage for a sustained recovery.
MACD: The daily MACD remains bearish, but the histogram is making higher lows. So long this continues, there are reasons to be optimistic in the near term.
Bias
The bias for ADA is neutral. The cryptocurrency has to break the key resistance at $0.60 to turn bullish.
Short-Term Prediction for ADA Price
Cardano suffered a significant correction this year, going from $1.6 (January) to $0.40 (May). At the time of this writing, it seems as if the cryptocurrency has a chance to enter a sustained relief rally. However, it’s important to remain very careful as the market remains very volatile.